
설명
https://chartshots.spotware.com/c/695bff3f3bc21
https://chartshots.spotware.com/c/695bffac03fb1
https://chartshots.spotware.com/c/695c0002aabb7
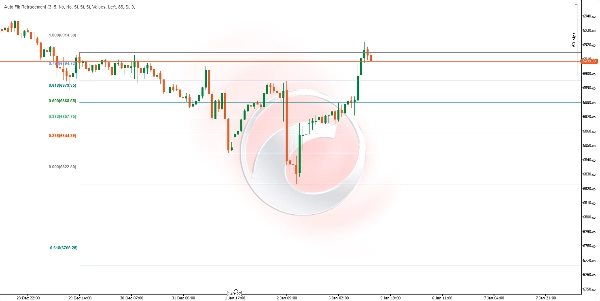
📊 자동 피보 되돌림
자동 피보 되돌림 은 최근의 중요한 가격 움직임을 기반으로 피보나치 되돌림 및 확장 수준을 자동으로 표시하는 기술적 분석 지표입니다. 수동 피보나치 도구와 달리, 이 지표는 시장 피벗 포인트를 자동으로 감지하고 실시간으로 수준을 업데이트합니다.
⚙️ 작동 원리
자동 피벗 감지
이 지표는 동적 지그재그 알고리즘을 사용하여 중요한 가격 고점과 저점을 식별합니다:
- 되돌아보기 (깊이): 피벗 포인트를 확인하기 위해 얼마나 많은 바를 거슬러 분석할지 정의합니다. 값이 높을수록 큰 변동을 감지하고, 값이 낮을수록 작은 움직임에 더 민감합니다.
- 민감도 (편차): 새로운 피벗을 형성하기 위해 가격 움직임이 얼마나 중요한지 제어합니다. 이는 10기간 ATR (평균 진폭 범위) 에 이 계수를 곱하여 계산됩니다. 값이 높을수록 노이즈를 걸러내고 중요한 움직임만 감지합니다.
피보나치 수준 계산
가장 최근의 두 피벗(고점과 저점)이 식별되면, 지표는 고전적인 피보나치 공식을 사용하여 각 수준을 계산합니다:
수준 = 기준 가격 + (이동 범위 × 피보나치 비율)
여기서:
- 기준 가격: 가장 최근 피벗의 가격 (방향이 반전되면 이전 피벗)
- 이동 범위: 두 피벗 간의 차이
- 사용 가능한 비율: 0, 0.236, 0.382, 0.5, 0.618, 0.65, 0.786, 1, 1.272, 1.414, 1.618, 1.65, 2.618, 2.65, 3.618, 3.65, 4.236, 4.618, 그리고 음수 수준 (-0.236, -0.382, -0.618, -0.65)
📈 용도
UseDescription
지지 및 저항 식별
수준 0.382, 0.5, 그리고 0.618 은 가격이 반응하는 고전적인 구역입니다 🔵
가격 목표 설정
확장 수준 (1.618, 2.618, 3.618, 4.236) 은 움직임이 얼마나 멀리 갈 수 있는지 예측하는 데 도움을 줍니다 🎯
진입 계획
추세 방향으로 진입하기 위해 주요 수준으로의 되돌림을 찾으세요 ⬆️⬇️
손절 설정
관련 피보나치 수준 너머에 손절을 설정하세요 🛑
반전 구역 확인
가격이 극단적인 확장 수준에 도달하면 소진을 나타낼 수 있습니다 🔄
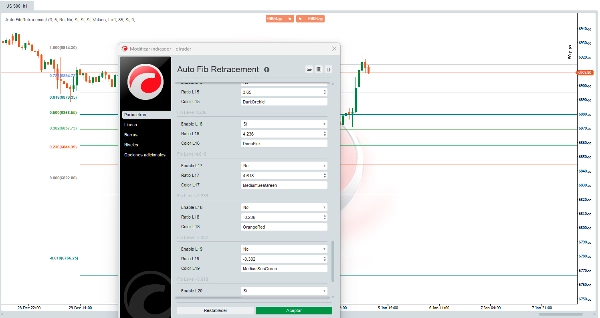
🛠️ 사용 방법
주요 매개변수
매개변수설명권장 값
민감도
작은 움직임을 필터링하는 편차 배수
3 (기본값)
되돌아보기
피벗 계산에 필요한 최소 바 수
10 (기본값)
방향 반전
수준 계산을 위한 기준점을 반전
비활성화됨
표시 옵션
옵션기능
왼쪽/오른쪽 확장
차트의 왼쪽 또는 오른쪽으로 수평선을 확장
가격 표시
각 수준의 정확한 가격을 표시
비율 표시
피보나치 비율(값 또는 백분율)을 표시
태그 위치
레이블을 왼쪽 또는 오른쪽에 위치시킴
구역 불투명도
수준 간 색상 구역의 투명도 조절
설정 가능한 피보나치 수준
22개 수준 각각은 다음과 같이 할 수 있습니다:
- 개별적으로 활성화 또는 비활성화
- 숫자 값을 수정
- 색상을 변경
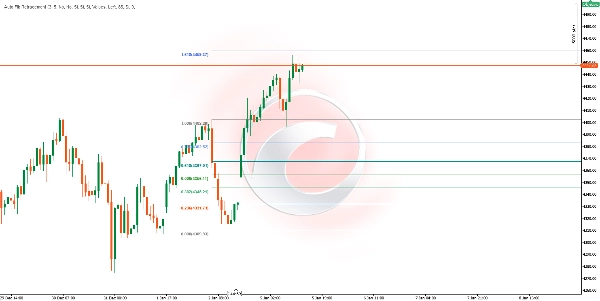
💡 구역 해석
연속된 수준 사이의 색상 구역은 시각적 식별을 용이하게 합니다:
- 녹색/파란 구역 (0.382 - 0.786): 추세에서 건강한 되돌림 구간. 진입을 위한 일반적인 구역. ✅
- 1.0 수준 구역: 이전 움직임의 100%를 나타냅니다. 주요 지지/저항 역할. ⚖️
- 빨강/분홍 구역 (1.618 이상): 움직임의 확장 구간. 가격이 이 구역에 도달하면 과도한 확장을 나타낼 수 있습니다. ⚠️
⚠️고려 사항
- 이 지표는 새로운 중요한 피벗을 감지할 때 자동으로 업데이트됩니다
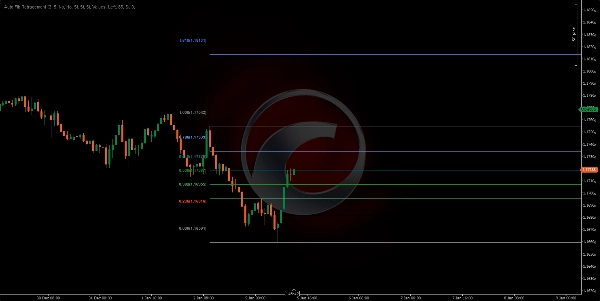
- 모든 시간대 및 금융 자산에서 작동합니다 .
- 피보나치 수준은 확률 구역이지 보장이 아닙니다
- 다른 지표나 가격 행동 분석과 함께 사용하는 것이 권장됩니다 .
- 횡보 또는 변동성이 큰 시장에서는 피벗이 자주 변경될 수 있습니다
📝 기술적 참고 사항
- 내부적으로 동적 피벗 감지를 위한 임계값 계산에 10기간 ATR 이 사용됩니다
- 정상 작동을 위해 되돌아보기 매개변수의 두 배에 해당하는 최소 과거 데이터가 필요합니다
- 성능 최적화를 위해 선과 구역은 마지막 바에서만 다시 그려집니다 🚀
요약
The indicator helps traders identify potential support and resistance zones, define price targets, plan entries on pullbacks, set stop-losses beyond key levels, and confirm reversal zones when price reaches extreme extensions. It works on any timeframe and financial asset, including Forex, stocks, commodities, indices, and cryptocurrencies such as BTCUSD, EURUSD, GBPUSD, XAUUSD, NAS100, and others.
Users can customize parameters like sensitivity, lookback period, direction inversion, and display options (line extension, price and ratio labels, zone opacity, and colors). Colored zones visually highlight key Fibonacci areas for easier interpretation. The indicator updates automatically with new pivots and redraws levels on the latest bar to optimize performance.


!["Gaussian Channel [Iridio Capital]" 로고](https://cdn.ctrader.com/image/webp/7c039209-5573-4a54-a072-f9528b503103_41960)


