설명
Smart Money Suite (Lite)는 전체 스위트의 복잡성 없이 모든 가격 행동 트레이더가 필요로 하는 핵심 스마트 머니 개념을 제공합니다. 차트에서 깔끔하고 신뢰할 수 있는 구조와 세션 컨텍스트를 원하는 트레이더를 위해 설계되었습니다. 그 이상도 그 이하도 아닙니다.
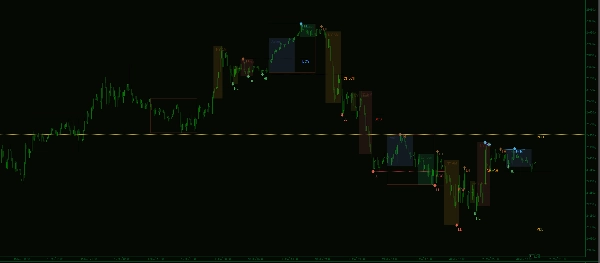
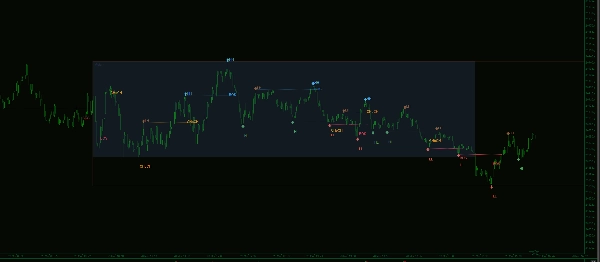
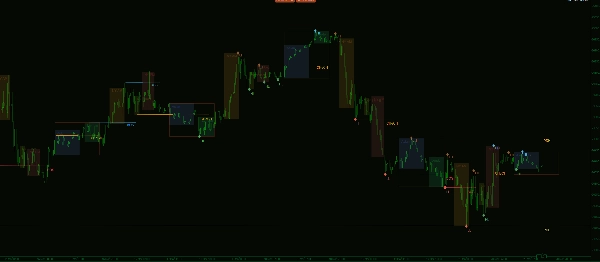
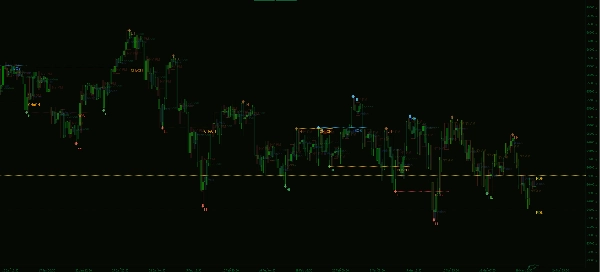
시장 구조는 전체 조회 창에서 자동으로 감지됩니다. 스윙 포인트는 실시간으로 Higher Highs, Lower Highs, Higher Lows, Lower Lows로 분류되어 현재 추세를 즉시 파악할 수 있습니다. 모든 구조 붕괴(BOS)는 라벨이 붙은 점선으로 표시되어 가격이 방향성 움직임에 확실히 진입한 위치를 정확히 볼 수 있습니다. 특성 변화(CHoCH) 신호는 주황색으로 강조되어 추세가 반전의 첫 신호를 보이는 순간을 식별하며, 이는 스마트 머니 트레이딩에서 가장 실행 가능한 신호 중 하나입니다.
이전 일 고가 및 저가는 브로커의 자체 바 데이터에서 자동으로 그려지며, 다가오는 세션을 위한 가장 널리 관찰되는 두 가지 기준 레벨을 제공합니다. 이들은 매일 수동 개입 없이 깔끔하게 업데이트됩니다.
세션 킬존은 아시아, 런던 오픈, 뉴욕 오전, 뉴욕 점심, 뉴욕 오후 각 세션 창의 실제 고가에서 저가까지를 채운 범위 상자로 그려집니다. 시간은 뉴욕 시간을 기준으로 하며 일광 절약 시간에 자동으로 조정됩니다. 상자는 고정된 수직선이 아닌 실제 가격 범위를 반영하기 때문에 각 세션이 얼마나 활발했는지와 주요 가격 극단이 어디에 형성되었는지를 즉시 확인할 수 있습니다.
모든 기능은 개별적으로 토글할 수 있습니다. 인디케이터는 새로운 바가 형성될 때만 다시 그려져 라이브 피드에서 차트를 부드럽고 깜박임 없이 유지합니다.
Smart Money Suite Pro로 업그레이드하면 주문 블록, 브레이커 블록, 공정 가치 갭, 유동성 레벨, 개장 갭, 프리미엄/디스카운트 존, 피보나치 및 전체 다중 시간 프레임 오버레이를 이용할 수 있습니다.