
설명
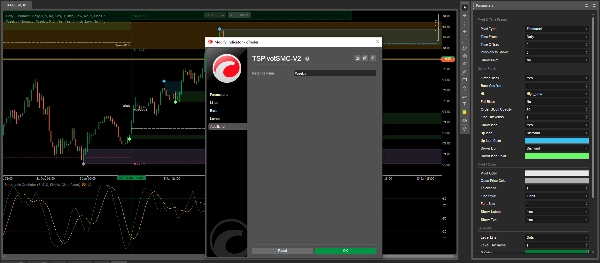
TSPivotSMC-V2: 고전 피벗과 기관 유동성의 융합
TSPivotSMC-V2는 단순한 피벗 포인트 지표가 아니라, 기관의 정밀함을 추구하는 트레이더를 위한 고급 스마트 머니 컨셉(SMC) 맵입니다. 우리는 고전 기술 분석의 가장 신뢰받는 도구를 유동성 탐지 엔진과 고확률 구역으로 변환했습니다.
주요 특징:
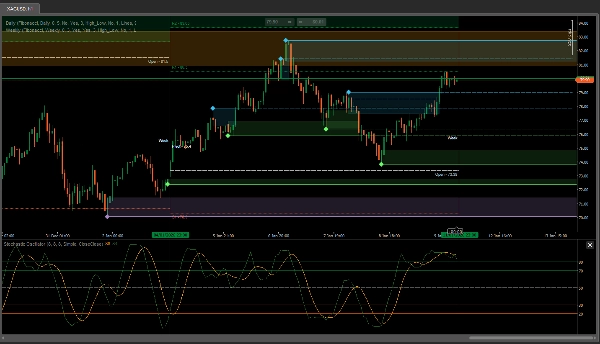
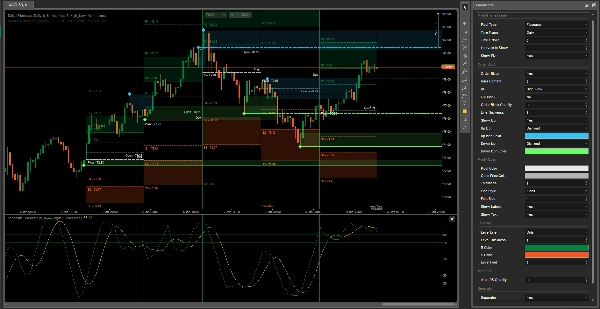
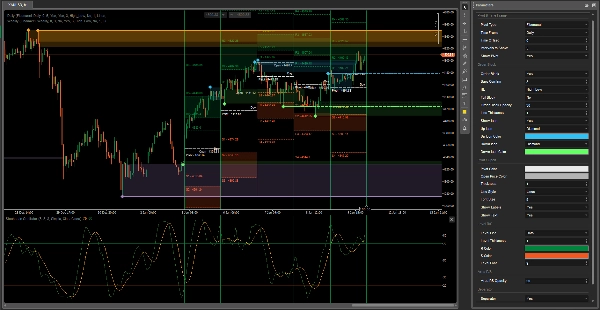
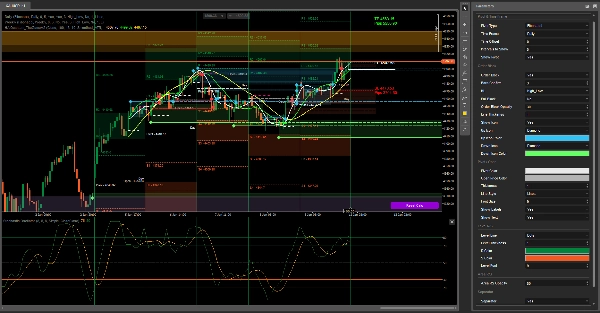
• 자동 세션 오더 블록: 이전 세션의 고가 및 저가 수준에 사각형을 식별하고 그려 중요한 공급 및 수요 구역을 표시합니다.
• 지능형 완화 관리: 가격이 블록을 돌파했을 때 이를 감지하여 실선 사각형을 점선 참조선으로 변경합니다. 이를 통해 차트를 깔끔하게 유지하면서 과거 돌파를 보존할 수 있습니다.
• 다중 타임프레임(MTF) 계층 구조: 레이어로 작동하도록 설계되었습니다. 정밀한 진입을 위해 일간 인스턴스를 적용하고, 시장 편향을 정의하기 위해 주간 인스턴스를 적용하여 고영향 융합을 볼 수 있습니다.
• 전문가 확인: 유동성 구역이 유효하며 단순한 시장 소음이 아님을 보장하기 위해 캔들스틱 확인 필터(Bars Confirm)를 포함합니다.
• 완전한 미적 사용자 정의: 각 타임프레임별로 색상, 불투명도 및 선 스타일을 독립적으로 구성하여 압박 속에서도 빠른 가격 읽기를 용이하게 합니다.
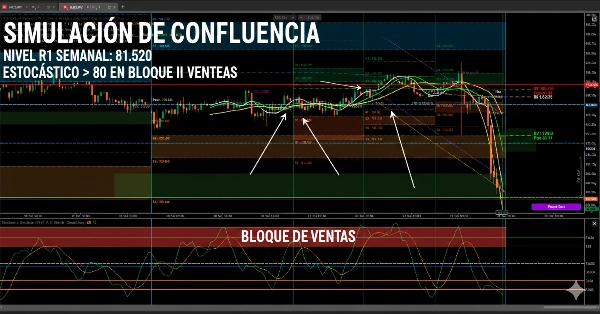
왜 TSPivotSMC를 선택해야 할까요?
전통적인 피벗은 단지 숫자만 제공하지만, TSPivotSMC-V2는 시장 내러티브를 제공합니다. 수학적 피보나치/표준 레벨과 기관 가격 행동을 결합하여 자금이 어디에 있고 언제 완화되었는지를 볼 수 있어 cTrader에서 독특한 경쟁 우위를 제공합니다.
스토어 사용자 참고: "더 높은 타임프레임에서 유동성 분석의 효과를 극대화하기 위해 두 개의 인스턴스(일간 및 주간)를 사용하는 것이 권장됩니다."
요약
Designed for multi-timeframe analysis, TSPivotSMC-V2 supports layering daily and weekly instances to refine entry points and define overall market bias. It includes a candlestick confirmation filter to validate liquidity zones and reduce noise. Users can customize colors, opacities, and line styles independently for each timeframe to enhance visual clarity under trading pressure.
By combining mathematical pivot levels with institutional price action, this tool provides a detailed market narrative, helping traders identify where liquidity resides and when it has been mitigated. It is applicable across multiple markets including Forex, indices, commodities, cryptocurrencies, and stocks. Using multiple timeframe instances is recommended to maximize liquidity analysis effectiveness.
고객 리뷰
5 | 100 % | |
4 | 0 % | |
3 | 0 % | |
2 | 0 % | |
1 | 0 % |


!["[Stellar Strategies] Smart ADX" 로고](https://cdn.ctrader.com/image/webp/af13b084-b6f6-41db-b7bc-c7e688b57b05_36929)


