
설명
1. "가속도 대 기준선 추세" 필터.
이것이 가장 큰 기술적 이점입니다.
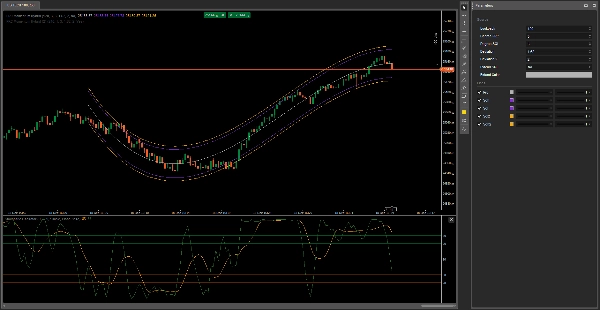
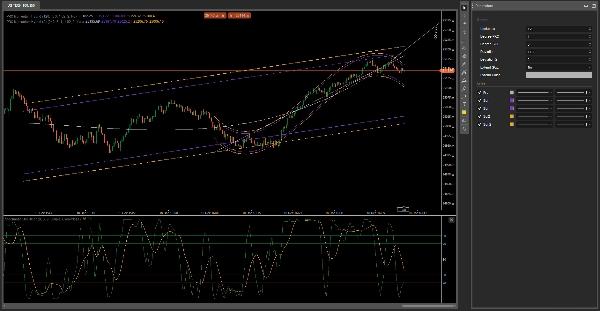
레벨 1 (직선): 시장의 관성 또는 평균 추세를 나타냅니다. 가격이 따라야 할 "고속도로"입니다.
레벨 3 (곡선): 시장의 가속도와 즉각적인 감정적 심리를 나타냅니다.
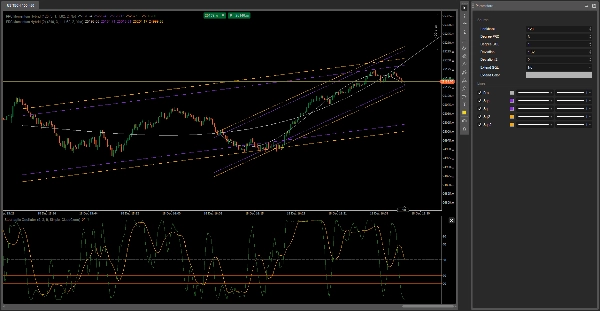
트레이더 이점: 레벨 3 채널이 곡선을 이루며 레벨 1 채널을 돌파할 때, 이는 시장의 클라이맥스(과속)를 나타냅니다. 가격이 과도하게 확장되어 곧 선형 기준으로 돌아올 것이라는 완벽한 경고입니다.
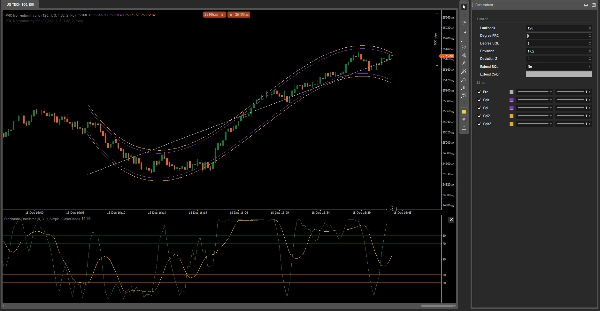
2. 변동성 스퀴즈 식별
이점: 주황색(직선)과 보라색(곡선) 선이 교차하는 지점에서 높은 확률의 노드가 형성됩니다.
설명 방법: "교차점을 찾아보세요. 가격이 직선과 곡선 모두에 의해 동시에 거부될 때, 가격이 넘을 수 없는 장애물에 부딪혔다는 이중 확인을 받는 것입니다."
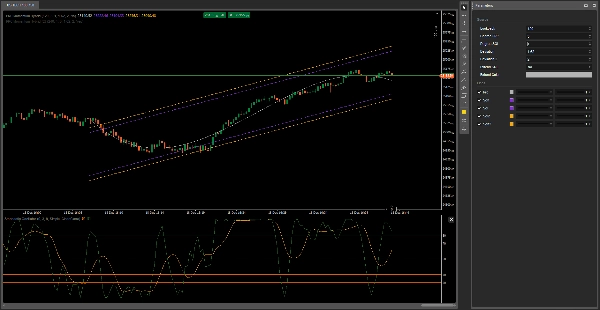
3. "추세 함정" (시각적 발산)
이점: 거짓 돌파를 피하는 데 도움을 줍니다.
설명: 때때로 가격이 선형 채널(1등급)을 돌파하여 매수 신호를 주지만, 3등급 채널은 이미 하락 곡선을 그리고 있습니다.
사용자 가치: "우리의 이중 설정은 함정으로부터 보호합니다: 직선이 '상승하라'고 말하지만 곡선이 '굽어지고' 있다면, 진입하지 마세요. 곡선은 항상 직선보다 먼저 소진을 감지합니다."
이것들이 제가 돈을 버는 데 도움을 주는 도구들입니다
https://ctrader.com/products/3441?u=Thomas-Sparrow
https://ctrader.com/products/526?u=Thomas-Sparrow
요약
AI 요약
PRC Momentum Hybrid is a technical indicator designed to analyze opposing market forces through a visual framework. It features a dual-channel system: Level 1 consists of straight lines representing the market’s baseline trend or inertia, while Level 3 comprises curved lines reflecting market acceleration and immediate emotional sentiment. Key functionality includes:
1. Acceleration vs. Baseline Trend Filter: Detects market climaxes when the acceleration channel breaks out of the baseline trend, signaling potential price reversals from overextended conditions.
2. Volatility Squeeze Identification: Highlights high-probability trading nodes where straight and curved lines intersect, indicating strong price rejection points confirmed by dual resistance.
3. Trend Trap Detection: Provides visual divergence alerts to avoid false breakouts by comparing signals from the linear and curved channels, helping traders identify exhaustion before trend continuation.
The indicator supports analysis across multiple markets including Forex, Indices, Commodities, Crypto, and Stocks. It is intended for use as a powerful visual tool to enhance decision-making by identifying trend strength, momentum shifts, and potential reversal zones.
지표 프로필
고객 리뷰
5.0
리뷰: 2
5 | 100 % | |
4 | 0 % | |
3 | 0 % | |
2 | 0 % | |
1 | 0 % |
고객 리뷰
December 22, 2025
PRC Momentum Hybrid offers a clean blend of price momentum and trend filtering. Fast, lightweight and easy to read, it helps spot acceleration and fading moves. Best used as confirmation with structure or levels. Alerts and ATR adaptation would make it even stronger.
상담
자주 묻는 질문(FAQ)
Forex
Indices
Commodities
Crypto
Stocks
트레이딩 봇, 지표, 플러그인 등 cTrader Store에서 제공되는 상품은 제3자 개발자에 의해 제공되며, 이는 단순히 정보 및 기술적 접근을 목적으로 제공된 것입니다. cTrader Store는 중개인이 아니며, 투자 조언, 개인별 추천 또는 향후 성과에 대한 어떠한 보장도 제공하지 않습니다.


가격
147
판매
11.19K
무료 설치