
AlgoCorner McGinley Dynamic
Wskaźnik
60 pobrania
Wersja 1.1, Jan 2026
Windows, Mac
Opis
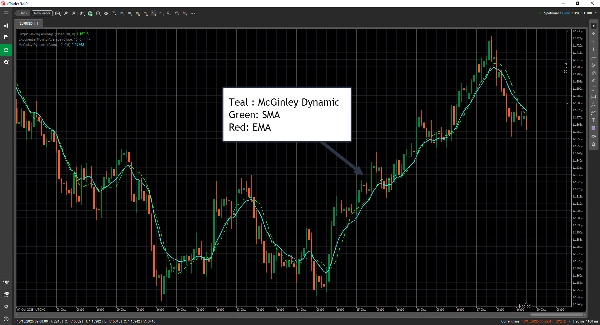
McGinley Dynamic to jedno z tych niedocenianych narzędzi technicznych, które faktycznie powstało z bardzo praktycznej obserwacji dotyczącej średnich kroczących.
Zostało stworzone przez Johna R. McGinleya, CMT, a jego głównym celem jest rozwiązanie powszechnych problemów tradycyjnych średnich kroczących — mianowicie opóźnienia oraz fałszywych sygnałów spowodowanych wahaniami prędkości rynku.
Oto, co stara się konkretnie rozwiązać:
🧩 1. Opóźnienie w średnich kroczących
- Zwykłe średnie kroczące (SMA, EMA) opóźniają się względem ceny, ponieważ opierają się na stałych okresach retrospektywnych.
- McGinley Dynamic automatycznie dostosowuje wygładzanie w zależności od prędkości rynku.
Gdy rynek porusza się szybko, przyspiesza dostosowanie; gdy rynek zwalnia, wygładza łagodniej.
👉 Efekt: śledzi cenę bliżej bez nadmiernej reakcji.
🌪️ 2. Fałszywe sygnały podczas okresów zmienności
- Tradycyjne średnie kroczące mogą dawać fałszywe sygnały na niestabilnych rynkach.
- McGinley wprowadził dynamiczny mianownik, który dostosowuje się proporcjonalnie do prędkości ruchu rynku.
Pomaga to zmniejszyć szumy i uniknąć niepotrzebnych sygnałów przecięcia.
⚙️ 3. Płynniejsze, samokorygujące się zachowanie
- Działa niemal jak automatycznie dostosowująca się średnia krocząca, co oznacza, że nie trzeba tak bardzo dopracowywać okresu.
- Sprawia to, że jest mniej wrażliwa na dane wejściowe użytkownika i zmienność rynku — coś w rodzaju „inteligentnej” średniej kroczącej.
Podsumowanie
Podsumowanie AI
AlgoCorner McGinley Dynamic is a technical indicator designed to improve upon traditional moving averages by reducing lag and false signals. Created by John R. McGinley, CMT, it automatically adjusts its smoothing based on market speed, allowing it to track price movements more closely without overreacting. The indicator employs a dynamic denominator that changes in proportion to market velocity, helping to minimize whipsaws and avoid unnecessary crossover signals during volatile or choppy market conditions. Acting as a self-correcting, auto-adjusting moving average, it requires less fine-tuning of parameters and is less sensitive to market volatility and user input. This makes it a practical tool for traders seeking a smoother, more responsive moving average that adapts naturally to changing market dynamics. It is applicable to Forex markets, including currency pairs such as EURUSD and GBPUSD.
Profil wskaźnika
Opinie klientów
0.0
Opinie: 0
Opinie klientów
Ten produkt nie ma jeszcze opinii. Wypróbowałeś(-aś) go już? Bądź pierwszy(-a) i powiedz o tym innym!
Dyskusja
Częste pytania
Forex
EURUSD
GBPUSD
Produkty dostępne za pośrednictwem cTrader Store, w tym boty handlowe, wskaźniki i wtyczki, dostarczane są przez deweloperów zewnętrznych i udostępniane wyłącznie w celach informacyjnych oraz w celu zapewnienia dostępu technicznego. cTrader Store nie jest brokerem i nie zapewnia doradztwa inwestycyjnego, nie udziela spersonalizowanych rekomendacji ani nie gwarantuje przyszłych wyników.


Cena
10
Sprzedaż
351
Bezpłatne instalacje