
VIX - volatility indicator
지표
2 구매
버전 1.2, Apr 2026
Windows, Mac
4.5
리뷰: 2
설명
이 독점 VIX 지표는 Average True Range (ATR)를 기반으로 하며, cTrader 5.5.13+.에 최적화된 시장 변동성에 대한 정확하고 깔끔한 분석을 제공합니다. 주요 변동과 잠재적 돌파를 확인하기 위해 스케일된 VIX 움직임과 거래량 분석을 결합합니다.
주요 기능 및 코드 품질
- 버그/경고 제로: 최신 cTrader API로 완전히 리팩토링되어 모든 기존 오류와 경고를 제거하여 최대 안정성과 성능을 보장합니다.
- ATR 기반 VIX: 극단적인 시장 상황에 맞게 정규화된 변동성의 반응형 측정을 제공합니다.
- 이중 확인: 변동성(VIX 라인)과 틱 거래량 데이터를 결합하여 높은 확률의 돌파 알림을 검증합니다.
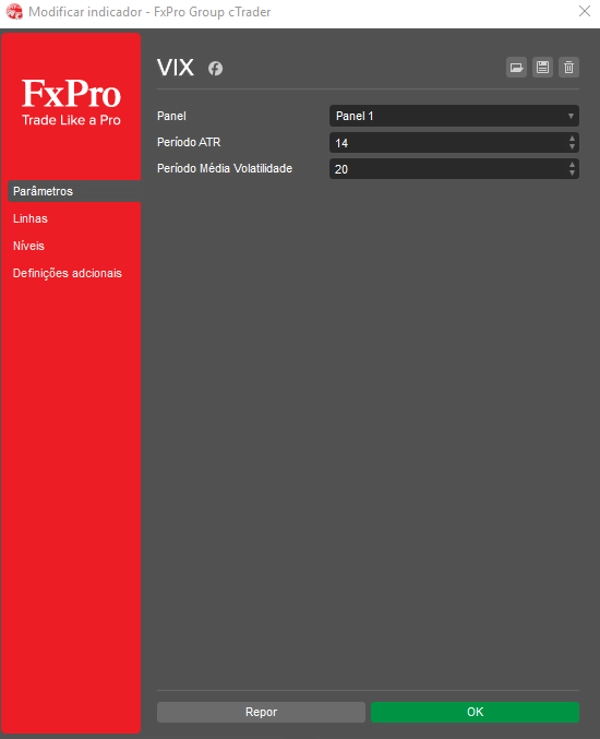
최대 인사이트를 위한 설정 맞춤화
원하는 낮은 VIX 수준과 높은 VIX 수준 임계값을 설정하여 거래 전략에 맞게 지표를 쉽게 미세 조정할 수 있습니다. 또한, 하단 패널의 VIX 라인 높이와 시각화를 정확하게 제어하기 위해 VIX 스케일 팩터를 조정하세요.
돌파 및 통합 신호 읽는 방법
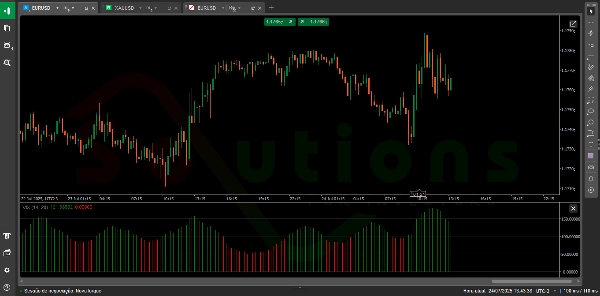
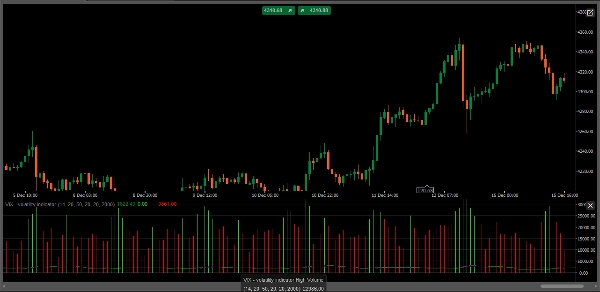
- 돌파 알림 (높은 변동성): VIX 라인이 높은 VIX 수준을 강하게 돌파하고, 그리고 높은 거래량(높은 거래량 히스토그램으로 표시됨)과 함께 나타나면, 이는 극도의 공포/탐욕을 확인하며 높은 확률의 시장 돌파를 신호합니다.
- 통합 신호 (낮은 변동성): VIX 라인이 낮은 VIX 수준 아래로 떨어지면, 이는 종종 시장의 안정기, 긴밀한 통합 또는 잠재적 평균회귀 기간을 나타내며, 다음 움직임 준비나 위험 축소에 이상적입니다.
- 거래량 인사이트: 지표는 배경에 높은 거래량(녹색)과 낮은 거래량(빨간색) 히스토그램을 표시하여 현재 가격 움직임 뒤의 유동성과 확신을 즉시 파악할 수 있게 합니다.
요약
AI 요약
The VIX - Volatility Indicator is a proprietary tool designed for the cTrader platform (version 5.5.13 and above) that measures market volatility using an Average True Range (ATR)-based approach. It combines a scaled VIX line with tick volume data to provide dual confirmation of market conditions, helping traders identify potential breakouts and consolidation phases.
Key features include:
- ATR-based VIX calculation for responsive volatility measurement normalized to detect extreme market conditions.
- Volume analysis with high (green) and low (red) volume histograms to assess liquidity and conviction behind price movements.
- Customizable parameters allowing users to set Low VIX Level and High VIX Level thresholds, as well as adjust the VIX Scale Factor for optimal visualization.
Usage signals:
- A breakout alert occurs when the VIX line surpasses the High VIX Level accompanied by high volume, indicating potential market breakouts driven by extreme fear or greed.
- A consolidation signal is identified when the VIX falls below the Low VIX Level, suggesting periods of low volatility, market calm, or potential mean reversion.
This indicator supports analysis across various markets including Forex, indices, commodities, stocks, and cryptocurrencies.
지표 프로필
고객 리뷰
4.5
리뷰: 2
5 | 50 % | |
4 | 50 % | |
3 | 0 % | |
2 | 0 % | |
1 | 0 % |
고객 리뷰
March 6, 2025
ngl, breaks are easier to judge and that is enough to keep testing it. It is not the whole trading plan.
February 28, 2025
reads better when the chart already supports the idea. Spread and slippage need a line in the notes.
상담
자주 묻는 질문(FAQ)
BTCUSD
Forex
Signal
Breakout
Indices
EURUSD
Commodities
GBPUSD
NZDUSD
Prop
Crypto
Stocks
XAUUSD
NAS100
USDJPY
트레이딩 봇, 지표, 플러그인 등 cTrader Store에서 제공되는 상품은 제3자 개발자에 의해 제공되며, 이는 단순히 정보 및 기술적 접근을 목적으로 제공된 것입니다. cTrader Store는 중개인이 아니며, 투자 조언, 개인별 추천 또는 향후 성과에 대한 어떠한 보장도 제공하지 않습니다.
이 작성자의 상품 더 보기


가격
가입일 05/02/2025
31
판매