
설명
맞춤형 RSI – 정밀하고 깔끔한 시각적 효과로 스팟 반전 포착
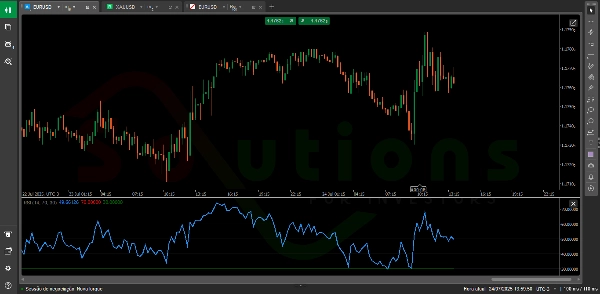
맞춤형 RSI는 고전적인 상대 강도 지수(RSI)의 향상된 버전으로, 트레이더가 과매수 및 과매도 구역—가격이 반전할 가능성이 높은 주요 영역—을 빠르게 식별할 수 있도록 설계되었습니다.
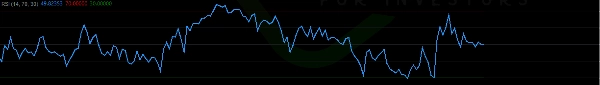
깔끔하고 직관적인 인터페이스로, 두 개의 완전히 사용자 지정 가능한 수평선(전통적인 70과 30 수준과 유사)을 표시하여 차트에서 높은 확률의 결정 지점을 명확히 표시합니다.
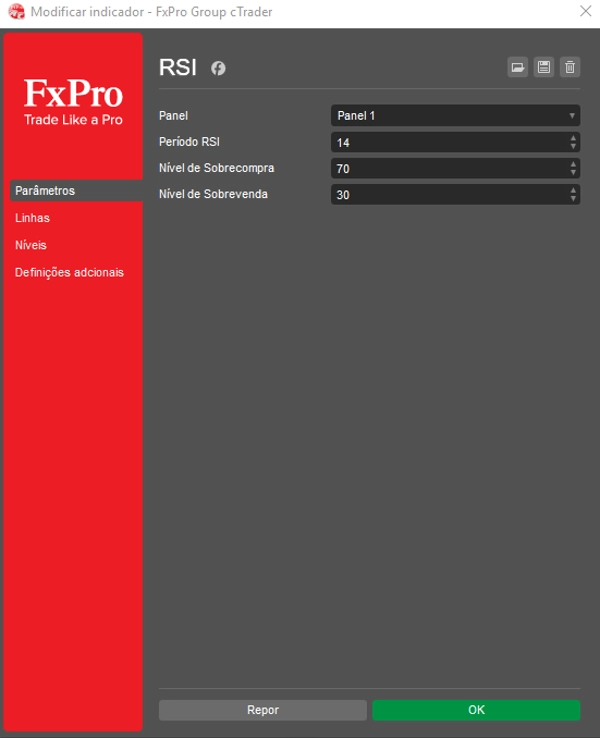
✅ 거래 스타일에 맞게 시간 프레임과 RSI 수준 조정
✅ 더 큰 확신으로 잠재적 반전 구역 식별
✅ 명확하고 깔끔한 지표로 기술적 분석 향상
모든 수준의 트레이더에게 완벽한 맞춤형 RSI는 원시 가격 데이터를 스마트하고 실행 가능한 인사이트로 변환하여 수익성 있는 의사결정을 위한 필수 도구입니다.
요약
AI 요약
Custom RSI is a technical indicator based on the classic Relative Strength Index (RSI) designed to identify overbought and oversold market zones. It calculates price movement strength using candlestick closing prices and displays two customizable horizontal lines, typically set at levels like 70 and 30, to mark critical decision points. Users can adjust the timeframe and RSI levels to suit their trading style, facilitating the identification of potential reversal zones. The indicator offers a clean, uncluttered visual interface that supports enhanced technical analysis across various markets including Forex, stocks, commodities, indices, and cryptocurrencies. Custom RSI is suitable for traders aiming to improve decision-making by highlighting high-probability reversal areas on their charts.
지표 프로필
고객 리뷰
4.0
리뷰: 3
5 | 0 % | |
4 | 100 % | |
3 | 0 % | |
2 | 0 % | |
1 | 0 % |
고객 리뷰
April 25, 2025
the workflow feels calmer, but it needs a few bad trades in the sample too.
April 20, 2025
April 12, 2025
the first reaction should not be the whole decision, but human context still matters here.
상담
자주 묻는 질문(FAQ)
BTCUSD
Forex
Signal
Indices
EURUSD
Commodities
GBPUSD
NZDUSD
RSI
Prop
Scalping
Crypto
Stocks
XAUUSD
NAS100
USDJPY
트레이딩 봇, 지표, 플러그인 등 cTrader Store에서 제공되는 상품은 제3자 개발자에 의해 제공되며, 이는 단순히 정보 및 기술적 접근을 목적으로 제공된 것입니다. cTrader Store는 중개인이 아니며, 투자 조언, 개인별 추천 또는 향후 성과에 대한 어떠한 보장도 제공하지 않습니다.
이 작성자의 상품 더 보기


가격
가입일 05/02/2025
30
판매