
SMCTimingIndicator
インジケーター
143 ダウンロード数
バージョン 1.0、Dec 2025
Windows、Mac
説明
📜 説明
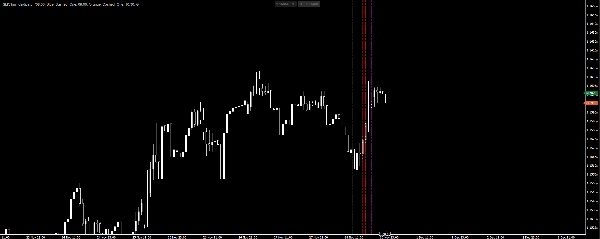
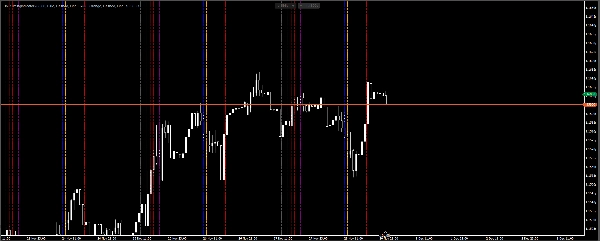
SMCタイミングインジケーターは、トレーダーが日中のタイミングと市場セッションの構造を視覚化するのに役立つcTraderプラットフォーム用のカスタマイズ可能なツールです。特に、スマートマネーコンセプト(SMC)およびICT戦略を適用するトレーダー向けに設計されており、正確なタイミングが重要です。
✨ 主な特徴
- 1日あたり最大8本の設定可能な垂直線
- 各線の時間、色、スタイル、太さの完全カスタマイズ
- 過去の取引日にわたる履歴線を表示するオプション
- UTCオフセットパラメーターによる柔軟なタイムゾーン調整
- enum、ヘルパー、サービスを使用したクリーンでモジュラーなアーキテクチャ
- オープンソースで無料で使用および共有可能
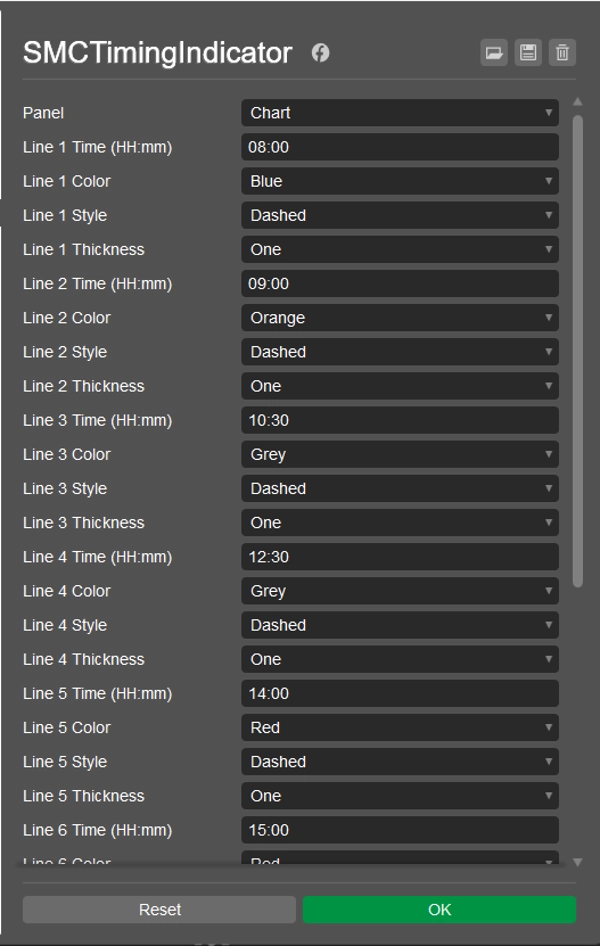
⚙️ パラメーター
各線には独自のパラメーターセット(時間、色、スタイル、太さ)があり、トレーディングのニーズに合わせてインジケーターを調整できます。
📈 使い方
- インジケーターをcTrader Automateにインストールします。
- 線の時間とスタイルを設定します。
- ローカルタイムゾーンまたはブローカーサーバー時間に合わせてUTCオフセットを調整します。
- 過去のセッションタイミングを視覚化するために履歴線の表示を有効にします。
📦 ライセンス
MITライセンスの下で公開されています – 無料で使用、変更、配布が可能です。
概要
AIによる概要
SMC Timing Indicator is a customizable indicator for the cTrader platform designed to mark trading sessions with vertical lines. It supports up to eight configurable vertical lines per day, each with adjustable time, color, style, and thickness settings. The indicator includes a UTC offset parameter to align session times with different time zones or broker server times. Users can enable the display of historical session lines to visualize past trading days. The tool is particularly suited for traders using Smart Money Concepts (SMC) and ICT strategies, where precise intraday timing and market session structure visualization are important. It features a modular architecture and is published under the MIT License, allowing free use, modification, and distribution. Installation and configuration are done through cTrader Automate.
インジケーターのプロフィール
カスタマーレビュー
0.0
レビュー: 0
カスタマーレビュー
この商品にはまだレビューがありません。お使いになったことがある方は、ぜひレビューをお願いします。
ディスカッション
よくあるご質問
Forex
EURUSD
SMC
cTrader Storeで入手可能な取引ボット、インジケーター、プラグインなどの商品は、第三者の開発者が提供するものであり、情報と技術の取得のみを目的としてご利用いただけます。cTrader Storeはブローカーではなく、投資助言や個人的な推奨を行うことも、将来のパフォーマンスを保証することもありません。
この作成者の他の商品


価格
登録日 24/09/2025
369
無料インストール