
説明
ダルヴァス・ボックス理論
ダルヴァス・ボックス理論は、1950年代にニコラス・ダルヴァスによって開発された取引手法です。これはモメンタムに基づく取引戦略で、価格の動きを利用して市場での潜在的なエントリーおよびエグジットポイントを特定します。
ダルヴァス・ボックスの仕組み
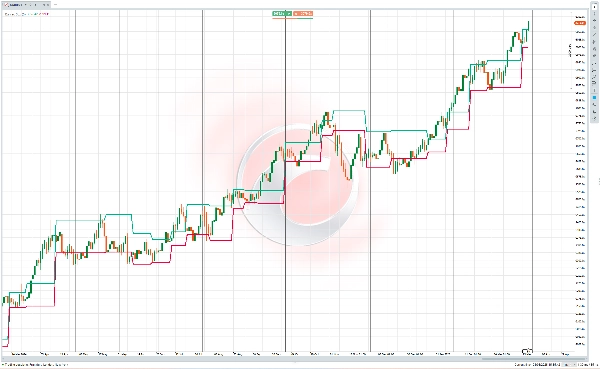
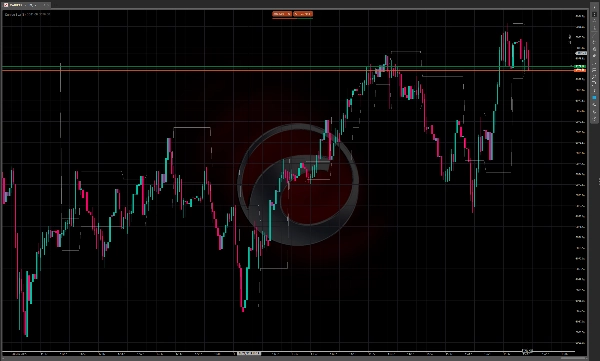
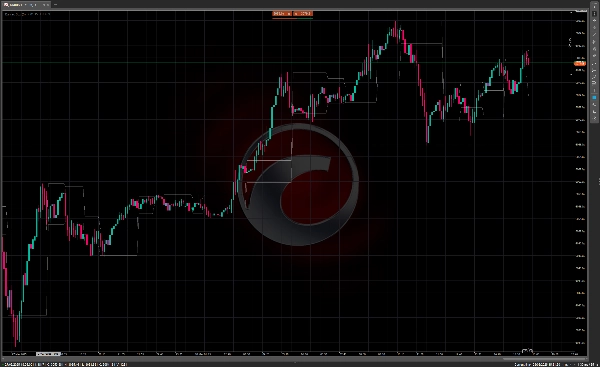
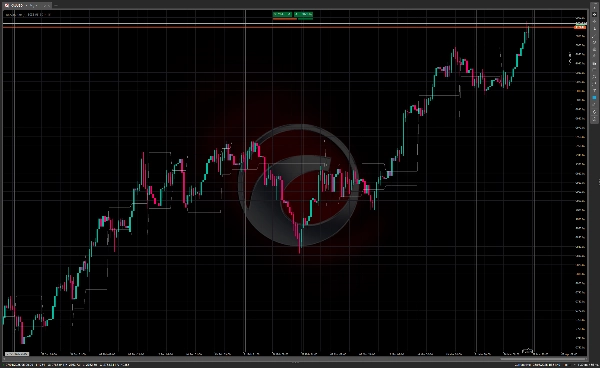
ダルヴァス・ボックスの方法は、株価がブレイクアウトする前に統合される「ボックス」または取引レンジを特定することを含みます。主な要素は以下の通りです:
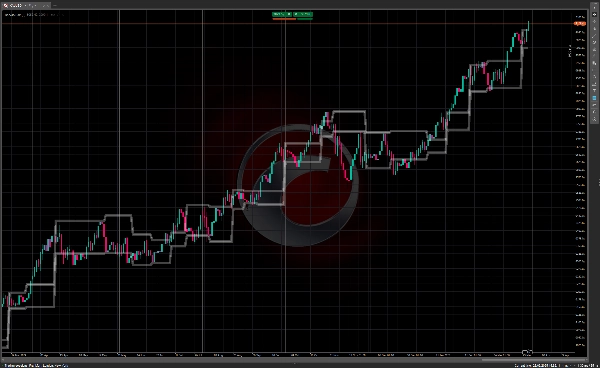
- 価格が明確な上限と下限を持つ定義された取引レンジ(「ボックス」)を形成する
- 上限は抵抗線を表し、下限はサポートとして機能する
- ボックスの上方へのブレイクアウトは潜在的な買いの機会を示す
- ボックスの下方へのブレイクダウンは売りのシグナルとして利用できる
この手法を使うトレーダーは通常、価格の動きとともに増加する出来高を探します。これはブレイクアウトの背後に強いモメンタムがあることを示唆するためです。
ダルヴァス・ボックス理論の歴史
ニコラス・ダルヴァス(1920-1977)は、取引の歴史においてかなり異例の人物でした。ハンガリー生まれで、専門のトレーダーではなく、半姉妹と共に「ダルヴァス&ジュリア」という社交ダンスデュオで踊っていたダンサーでした。
1950年代にダンス団体と共に世界を巡る中で、ダルヴァスは株取引を試み始めました。彼の状況は独特で、ツアー中に訪れた各都市で配達される新聞の株価表だけを基に投資判断を下すことが多かったのです。
ダルヴァスは試行錯誤を通じてボックス理論を発展させました。最初は市場で損失を出しましたが、徐々に手法を洗練させていきました。1956年から1958年の間に、彼はボックス手法を使って1万ドルの投資を200万ドル以上に増やしたと報告されており、これは注目を集める驚異的な成果でした。
1960年にダルヴァスは「How I Made $2,000,000 in the Stock Market」という本で自身の手法を発表し、これは取引文献の古典となりました。この本は彼の軌跡を詳述し、ボックス理論を説明し、このアプローチを主流に押し上げました。
ダルヴァスの手法が特に注目されたのは、そのシンプルさと金融業界の外部者によって開発された点でした。彼は主に価格の動きと出来高に注目し、ファンダメンタル分析よりもこれを重視しました。このアプローチは当時はやや斬新でしたが、その後多くのテクニカル取引システムに影響を与えました。
ダルヴァス・ボックスの手法は今日でもテクニカルトレーダーの間で人気があり、特にトレンド市場でモメンタムベースの戦略を追うトレーダーに支持されています。


