
VegaXLR - Analysis Tools Alerts
Indicador
2 compras
Versão 1.1, Apr 2026
Windows, Mac
4.5
Avaliações: 2
Descrição
cTrader Analysis Tools Alerts é um indicador tudo-em-um projetado para aprimorar sua experiência de gráficos adicionando alertas, etiquetas e codificação de cores automática a várias ferramentas de desenho.
Recursos:
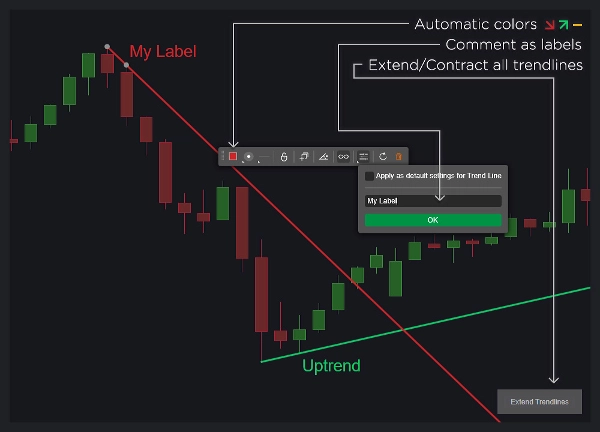
- Linhas de Tendência:
-
- Exibir etiquetas personalizadas usando comentários de objeto.
- Mudanças dinâmicas de cor baseadas na direção da linha de tendência.
- Opção para remover linhas de tendência após um alerta.
- Ativar ou desativar alertas específicos para linhas de tendência.
- Estender ou contrair todas as linhas de tendência com um único clique.
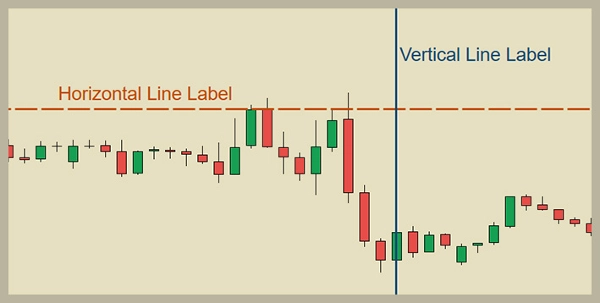
- Linhas Horizontais e Verticais:
-
- Exibir etiquetas personalizadas usando comentários de objeto.
- Excluir linhas automaticamente após um alerta.
- Configurar alertas para cada tipo de linha.
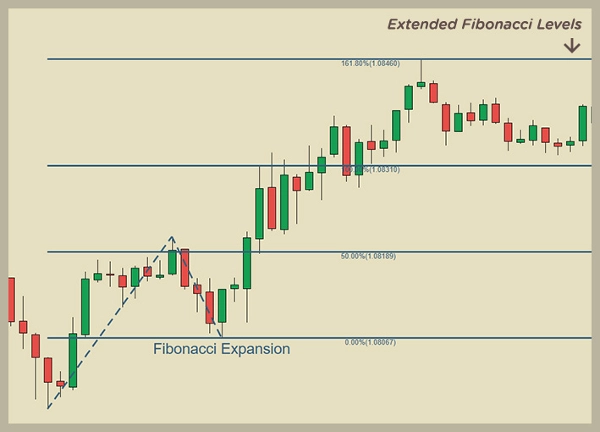
- Níveis de Retração e Expansão de Fibonacci:
-
- Exibir etiquetas personalizadas usando comentários de objeto.
- Estender automaticamente as linhas de nível até o infinito.
- Opção para excluir objetos após um alerta.
- Atribuir cores baseadas na direção do desenho.
- Ativar ou desativar alertas para níveis de Fibonacci.
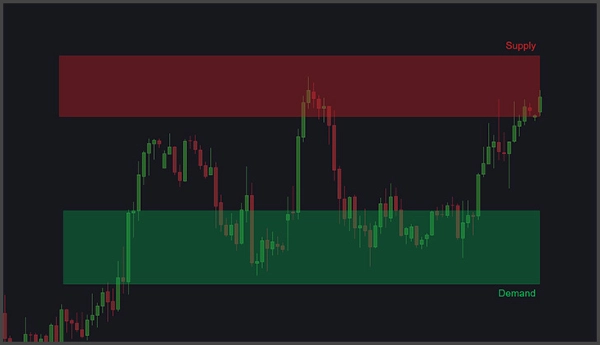
- Retângulos (Áreas de Oferta e Demanda):
-
- Exibir etiquetas personalizadas usando comentários de objeto.
- Alertas para interações de preço e picos de volume de ticks.
- Definir parâmetros para alertas de picos de volume de ticks, incluindo barras de retrocesso, aumento percentual de volume e período de pausa após o alerta.
- Preenchimento automático do retângulo e extensão até a vela ativa.
- Personalização Geral:
-
- Ajustar posições das etiquetas e tamanhos do texto para cada tipo de objeto.
- Personalizar cores automáticas.
- Incluir comentários de objeto nas mensagens de alerta.
- Ativar ou desativar alertas para cada tipo de objeto.
- Alertas e Ajuda:
-
- Receba alertas via som, pop-ups, Telegram e email.
- Capturas de tela automáticas do gráfico enviadas para o Telegram.
- Guia do Usuário acessível através de um pequeno botão no gráfico.
Esta ferramenta é ideal para traders que utilizam suporte e resistência, oferta e demanda, Fibonacci ou linhas de tendência em suas estratégias.
Resumo
Resumo de IA
VegaXLR - Analysis Tools Alerts is an all-in-one indicator for the cTrader platform that enhances chart analysis by integrating alerts, labels, and automatic color-coding with various drawing tools. It supports trendlines, horizontal and vertical lines, Fibonacci retracement and expansion levels, and rectangles representing supply and demand areas.
Key features include:
- Trendlines: Custom labels from object comments, dynamic color changes based on direction, options to remove or extend trendlines after alerts, and toggle alerts per trendline.
- Horizontal and Vertical Lines: Custom labels, automatic deletion after alerts, and configurable alerts per line type.
- Fibonacci Levels: Custom labels, infinite extension of level lines, color assignment by drawing direction, and alert enable/disable options.
- Rectangles (Supply and Demand): Custom labels, alerts for price interactions and tick volume spikes with adjustable parameters, automatic fill and extension to the active candle.
- Overall customization allows adjustment of label positions, text sizes, automatic colors, inclusion of comments in alerts, and enabling/disabling alerts per object type.
- Alerts can be received via sound, pop-ups, Telegram, and email, with automatic chart screenshots sent to Telegram.
- A user guide is accessible directly on the chart.
This tool is suited for traders employing support and resistance, supply and demand, Fibonacci, or trendline strategies.
Perfil do indicador
Categoria do indicador
Suporte e resistência
Tipo de resultado
Visualização
Requisitos de dados
Apenas barras
Sinais suportados
Cruzamento
Quebra
Toque no nível
Quebra de nível
Inversão
Força da tendência
Avaliações de clientes
4.5
Avaliações: 2
5 | 50 % | |
4 | 50 % | |
3 | 0 % | |
2 | 0 % | |
1 | 0 % |
Conversa
Perguntas frequentes
Fibonacci
Forex
Supply & Demand
Support & Resistance
Os produtos disponíveis através da cTrader Store, incluindo bots de negociação, indicadores e plugins, são fornecidos por programadores terceiros e são disponibilizados apenas para fins informativos e de acesso técnico. A cTrader Store não é um corretor e não fornece aconselhamento em matéria de investimento, recomendações pessoais ou qualquer garantia de desempenho no futuro.


Preço
215
Vendas
677
Instalações gratuitas