
Laguerre RSI
Indicador
653 transferências
Versão 1.0, Oct 2024
Windows, Mac
5.0
Avaliações: 1
Descrição
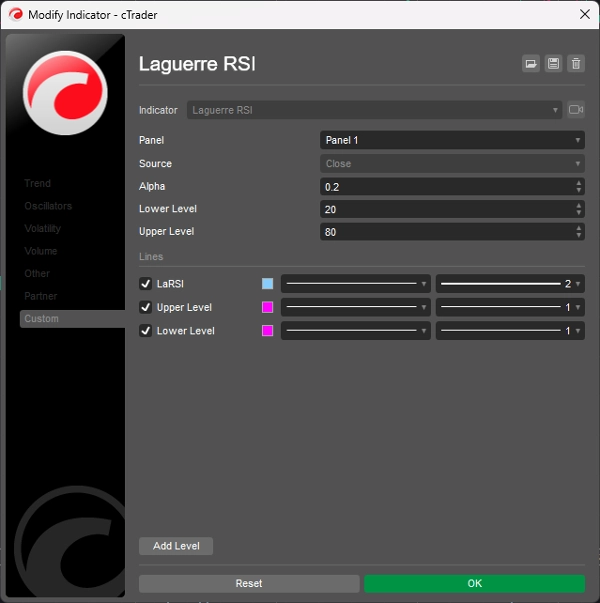
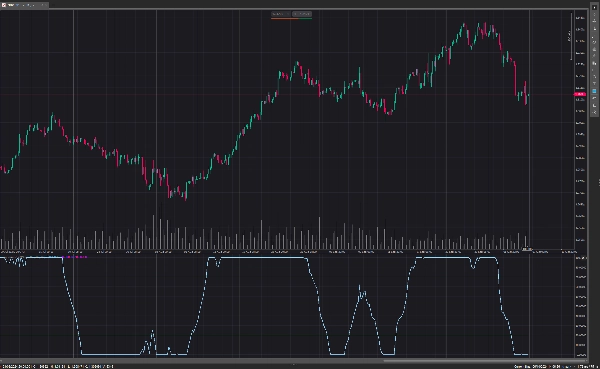
Laguerre RSI é baseado no Filtro Laguerre de John EHLERS para evitar o ruído do RSI.
Altere o coeficiente alfa para aumentar/diminuir o atraso e a suavidade.
o
Compre quando o Laguerre RSI cruzar para cima acima de 20.
Venda quando o Laguerre RSI cruzar para baixo abaixo de 80.
Enquanto o indicador permanecer estável acima de 80, uma tendência de alta é forte.
Enquanto o indicador permanecer estável abaixo do nível 20, significa que uma tendência de baixa é forte.
Resumo
Resumo de IA
Laguerre RSI is a technical indicator based on John Ehlers' Laguerre Filter designed to reduce the noise commonly found in traditional Relative Strength Index (RSI) calculations. It allows users to adjust the alpha coefficient to control the lag and smoothness of the indicator, tailoring its responsiveness to market conditions. The indicator generates buy signals when the Laguerre RSI crosses upward above the 20 level and sell signals when it crosses downward below the 80 level. Additionally, a flat reading above 80 indicates a strong uptrend, while a flat reading below 20 signals a strong downtrend. This indicator is used to identify trend strength and potential entry and exit points by filtering out market noise inherent in standard RSI measurements.
Perfil do indicador
Avaliações de clientes
5.0
Avaliações: 1
5 | 100 % | |
4 | 0 % | |
3 | 0 % | |
2 | 0 % | |
1 | 0 % |
Avaliações de clientes
July 14, 2025
Pros: Smooths RSI using Laguerre filter, reducing noise and lag. Clear overbought/oversold levels. Great for scalping. Cons: No alerts or tooltips. Requires confirmation with trend filters. Lacks setting templates and advanced features.
Conversa
Perguntas frequentes
RSI
Os produtos disponíveis através da cTrader Store, incluindo bots de negociação, indicadores e plugins, são fornecidos por programadores terceiros e são disponibilizados apenas para fins informativos e de acesso técnico. A cTrader Store não é um corretor e não fornece aconselhamento em matéria de investimento, recomendações pessoais ou qualquer garantia de desempenho no futuro.
Mais deste autor


Preço
2
Vendas
6.95K
Instalações gratuitas