
STC
Indicador
278 transferências
Versão 1.0, Jan 2025
Windows, Mac
5.0
Avaliações: 2
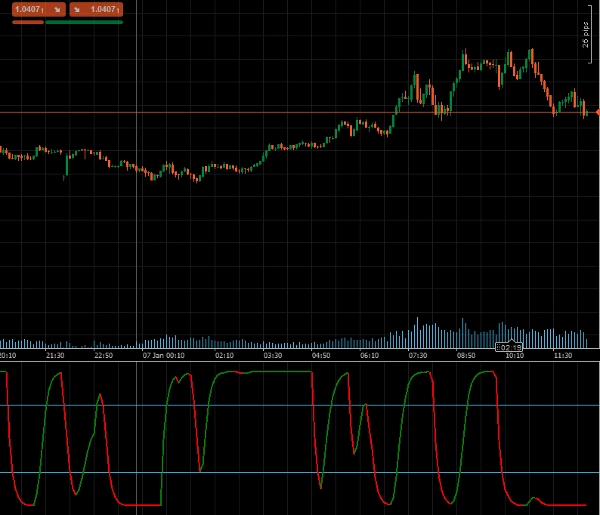
Descrição
O Schaff Trend Cycle (STC), desenvolvido pelo renomado analista técnico Doug Schaff, é um indicador avançado de negociação projetado para identificar tendências e reversões de mercado com velocidade e precisão excepcionais. Baseado na ideia inovadora de combinar componentes de tendência e ciclo, o STC utiliza médias móveis exponenciais (EMAs) e cálculos estocásticos para superar as limitações de indicadores defasados como MACD ou Oscilador Estocástico. Essa abordagem única fornece sinais de negociação mais precoces e confiáveis, oferecendo uma vantagem significativa na detecção de tendências e análise de mercado.
Principais Características:
- Detecção Precoce de Tendência: Combina médias móveis exponenciais (EMAs) com cálculos estocásticos para capturar tendências mais rapidamente.
- Configurações Personalizáveis: Ajuste o comprimento, MA rápido, MA lento, tipo de MA e fator de suavização para adequar à sua estratégia de negociação.
- Alertas Visuais: Mudanças dinâmicas de cor indicam tendências de alta ou baixa, facilitando a interpretação das condições do mercado.
- Suporte para Níveis de Sobrecompra/Sobrevenda: Níveis incorporados (25 e 75) ajudam a identificar potenciais pontos de reversão do mercado.
Parâmetros
- Comprimento: Define o número de períodos para o cálculo da tendência.
- Comprimento do MA Rápido: Define o comprimento da média móvel rápida.
- Comprimento do MA Lento: Especifica o comprimento da média móvel lenta.
- Tipo de MA: Permite a seleção do tipo de média móvel (por exemplo, EMA, SMA).
- Fator de Suavização: Ajusta o fator de suavização para sinais de tendência mais refinados.
Saídas
- STC: Fornece o valor principal do Schaff Trend Cycle, representando a direção e força da tendência, para uso programático em sistemas de negociação automatizados.
- STCBull: Destaca condições de tendência de alta.
- STCBear: Destaca condições de tendência de baixa.
Resumo
Perfil do indicador
Avaliações de clientes
5.0
Avaliações: 2
5 | 100 % | |
4 | 0 % | |
3 | 0 % | |
2 | 0 % | |
1 | 0 % |
Avaliações de clientes
August 12, 2025
Pros: Fast and accurate trend detection, earlier signals than MACD, customizable levels. Cons: No alerts, no MTF mode, no trade statistics.
Conversa
Perguntas frequentes
MACD
Os produtos disponíveis através da cTrader Store, incluindo bots de negociação, indicadores e plugins, são fornecidos por programadores terceiros e são disponibilizados apenas para fins informativos e de acesso técnico. A cTrader Store não é um corretor e não fornece aconselhamento em matéria de investimento, recomendações pessoais ou qualquer garantia de desempenho no futuro.
Mais deste autor


![Logótipo de "High-Low Divergence [Iridio Capital]"](https://cdn.ctrader.com/image/webp/443c4661-7abb-40f1-842f-4b6ec560649b_40914)


Preço
Desde 24/09/2024
4.46K
Instalações gratuitas