
PDHL
Indicador
1.85K transferências
Versão 1.0, Sep 2024
Windows, Mac
2.5
Avaliações: 2
Descrição
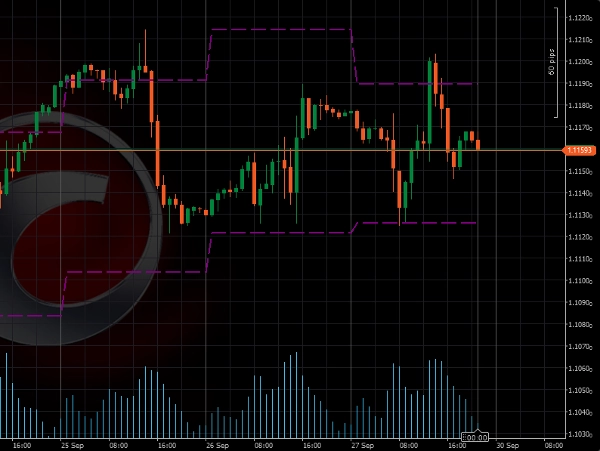
Apresentando o Indicador de Negociação High-Low
Este indicador foi projetado para traçar automaticamente os níveis de preço mais altos e mais baixos do dia anterior no seu gráfico. Esta ferramenta ajuda você a identificar rapidamente níveis-chave para possíveis rompimentos e reversões.
Principais Benefícios:
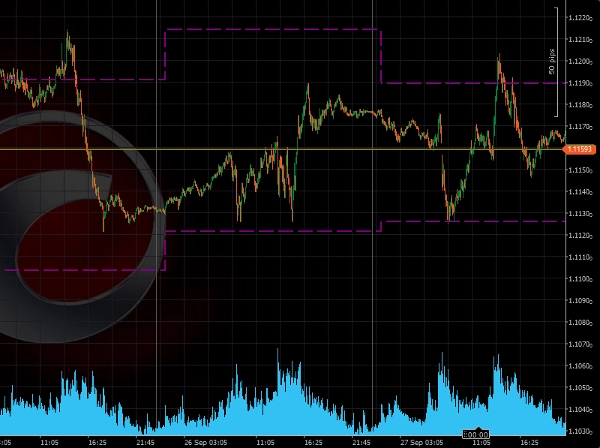
- Ideal para Negociação de Rompimentos: Este indicador destaca níveis críticos de preço do dia anterior, que frequentemente são usados como pontos de referência para estratégias de rompimento. Negociar rompimentos acima ou abaixo desses níveis pode oferecer configurações de alto potencial.
- Simples, mas Eficaz: O Indicador de Negociação High-Low foca em um dos aspectos mais importantes da ação do preço – a máxima e mínima do dia anterior. Ao incorporar esses níveis em sua estratégia, você obtém uma percepção mais clara da estrutura do mercado e dos pontos potenciais de reversão.
Atenções:
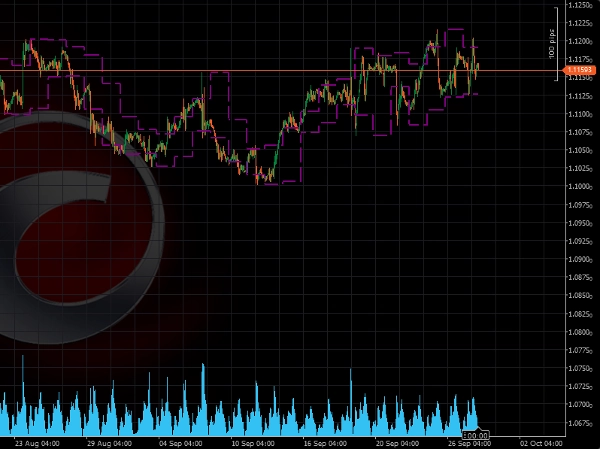
- Melhor utilizado em intervalos de tempo inferiores a 1 Dia
Configurações:
- Incluir Domingo: padrão = não
Resumo
Resumo de IA
The PDHL (Previous Day High & Low) indicator automatically plots the prior day's highest and lowest price levels on trading charts. It is designed to assist traders in identifying key price levels that may signal potential breakouts or reversals. By highlighting these critical levels, the indicator supports breakout trading strategies, providing reference points for entering trades when price moves above or below the previous day's range. The tool emphasizes simplicity and effectiveness by focusing on essential price action elements, helping traders better understand market structure and potential turning points. It is best used on intraday timeframes shorter than one day. A configurable setting allows users to include or exclude Sunday in the calculation, with the default setting excluding it.
Perfil do indicador
Avaliações de clientes
2.5
Avaliações: 2
5 | 0 % | |
4 | 0 % | |
3 | 50 % | |
2 | 50 % | |
1 | 0 % |
Avaliações de clientes
October 9, 2025
What Timezone is it in at default? It seems to fail to get the accurate Highs and lOws for different istruments. You could add that as a customisable input. Please add closing price too
July 9, 2025
Pros: Simple and clear display of previous day's high/low levels. Stable performance. Easy to use and customize. Cons: No breakout alerts. No visual zone fill option. Lacks additional filters or Fibo levels.
Conversa
Perguntas frequentes
Breakout
Os produtos disponíveis através da cTrader Store, incluindo bots de negociação, indicadores e plugins, são fornecidos por programadores terceiros e são disponibilizados apenas para fins informativos e de acesso técnico. A cTrader Store não é um corretor e não fornece aconselhamento em matéria de investimento, recomendações pessoais ou qualquer garantia de desempenho no futuro.
Mais deste autor


![Logótipo de "[Stellar Strategies] Inside Bar with Signals"](https://cdn.ctrader.com/image/webp/1d9e8bfa-3b2c-4440-bb37-5856902008a7_30683)

Preço
Desde 24/09/2024
4.47K
Instalações gratuitas