
Descrição
📊 Visão Geral
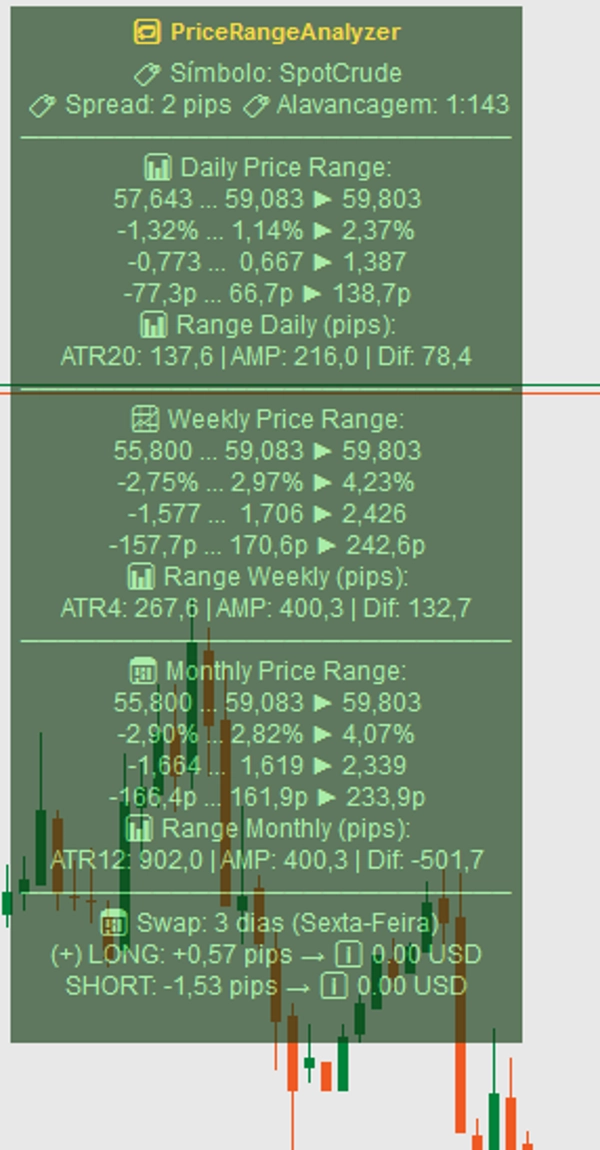
Painel abrangente de informações de negociação em múltiplos períodos que consolida dados essenciais do mercado, análise de faixa baseada em ATR e cálculos inteligentes de swap em uma única interface personalizável. Projetado para traders sérios que precisam de acesso rápido a métricas críticas de negociação em vários períodos.
✨ Principais Recursos
Análise Multi-Período
- Faixas e variações de preço Diárias, Semanais e Mensais
- Cálculos simultâneos de ATR para todos os períodos com períodos personalizáveis
- Cálculos em tempo real de porcentagem e variação em pips
- Visualização da faixa de preço com indicadores direcionais
Gerenciamento Inteligente de Swap
- Detecção automática de swap triplo (quarta-feira e sexta-feira)
- Listas de símbolos personalizáveis para diferentes cronogramas de swap
- Cálculo de swap em tempo real para posições abertas
- Suporte para símbolos baseados em % e em pips
Exibição Profissional
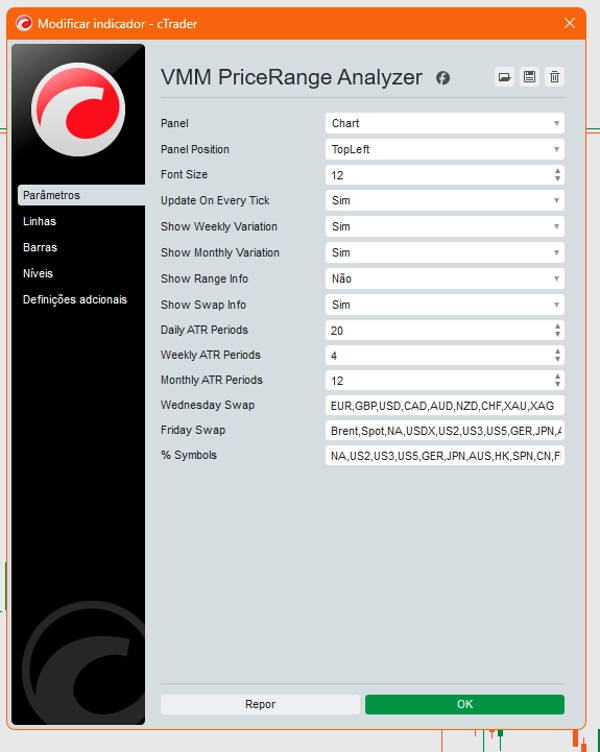
- Posição do painel totalmente personalizável (4 cantos)
- Esquema de cores dinâmico baseado na direção do mercado
- Tamanho da fonte ajustável e opacidade
- Layout limpo e organizado de informações
⚙️ Parâmetros
Configuração do Painel
Posição do Painel- Escolha entre 4 cantos da tela (TopLeft, TopRight, BottomLeft, BottomRight)Tamanho da Fonte- Ajuste o tamanho do texto para legibilidadeAtualizar a Cada Tick- Atualizações em tempo real ou somente no fechamento da barraMostrar Variação Semanal- Alternar exibição de dados semanaisMostrar Variação Mensal- Alternar exibição de dados mensaisMostrar Informações de Faixa- Exibir informações detalhadas da faixaMostrar Informações de Swap- Exibir cálculos de swap
Configurações de ATR
Períodos de ATR Diários- Períodos para cálculo diário de ATR (1-100)Períodos de ATR Semanais- Períodos para cálculo semanal de ATR (1-100)Períodos de ATR Mensais- Períodos para cálculo mensal de ATR (1-100)
Configuração de Símbolos
Swap de Quarta-feira- Símbolos separados por vírgula com swap triplo na quarta-feiraSwap de Sexta-feira- Símbolos separados por vírgula com swap triplo na sexta-feira% Símbolos- Símbolos onde os valores são baseados em porcentagem vs baseados em pips
🔧 Como Funciona
Análise de Faixa
Calcula e exibe:
- Preço atual em relação às faixas diárias/semanais/mensais
- Mudanças percentuais em relação aos fechamentos anteriores
- Movimentos em pips para planejamento preciso de entrada/saída
- Medições de volatilidade baseadas em ATR
Inteligência de Swap
- Detecta automaticamente quando o swap triplo se aplica
- Calcula custos de swap para posições longas e curtas
- Mostra custos reais de swap para posições abertas atualmente
- Suporta diferentes tipos de símbolos com cálculos apropriados
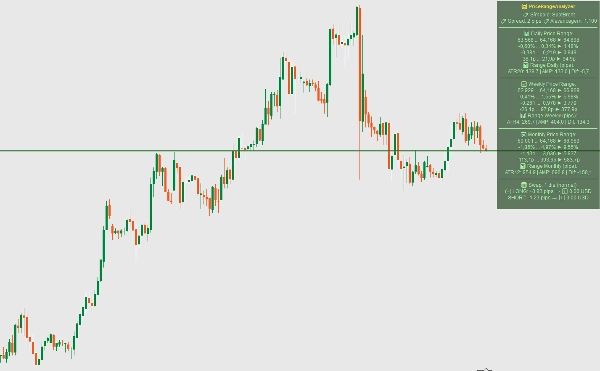
Indicadores Visuais
- Cores do painel mudam com base na direção diária do mercado
- Painel verde para dias de alta, vermelho para baixa
- Setas direcionais claras mostrando o movimento do preço
- Seções organizadas com separadores para fácil leitura
🎯 Casos de Uso
Para Traders de Posição
- Monitorar faixas multi-período para melhor timing de entrada
- Entender custos de swap antes de manter posições durante a noite
- Acompanhar desenvolvimentos de preço semanais e mensais
Para Traders Diários
- Acesso rápido a informações de spread e alavancagem
- Monitorar faixa diária e ATR para avaliação de volatilidade
- Planejar negociações com base nos níveis máximos/mínimos diários
Para Todos os Traders
- Visão consolidada de métricas críticas de negociação
- Prevenção de erros custosos no cálculo de swap
- Interface profissional e limpa que economiza espaço na tela
📈 Benefícios
- Economia de Tempo - Todas as informações essenciais em um só lugar
- Prevenção de Erros - Cálculos automáticos de swap
- Melhores Decisões - Perspectiva multi-período
- Personalizável - Adapta-se ao seu estilo de negociação
- Profissional - Exibição limpa e de nível institucional
⚡ Desempenho
- Otimizado para uso mínimo de CPU
- Atualiza somente quando necessário (configurável)
- Gerenciamento eficiente de memória para sessões longas
Perfeito para traders que desejam inteligência de mercado de nível profissional sem precisar alternar entre várias janelas ou calculadoras!
Resumo
Avaliações de clientes
5 | 100 % | |
4 | 0 % | |
3 | 0 % | |
2 | 0 % | |
1 | 0 % |


