Descrição
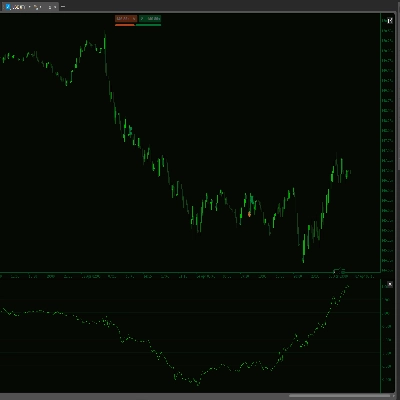
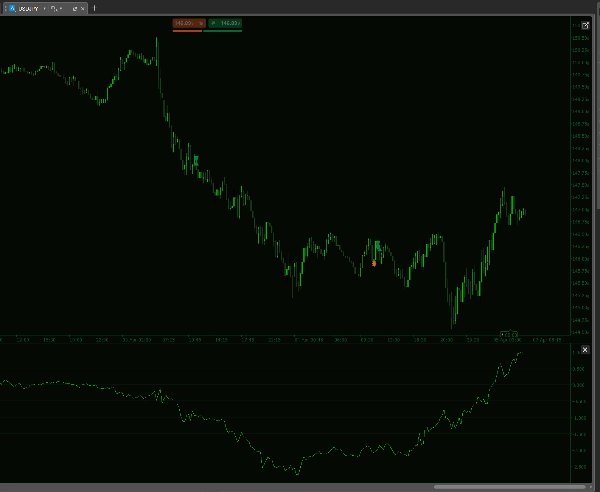
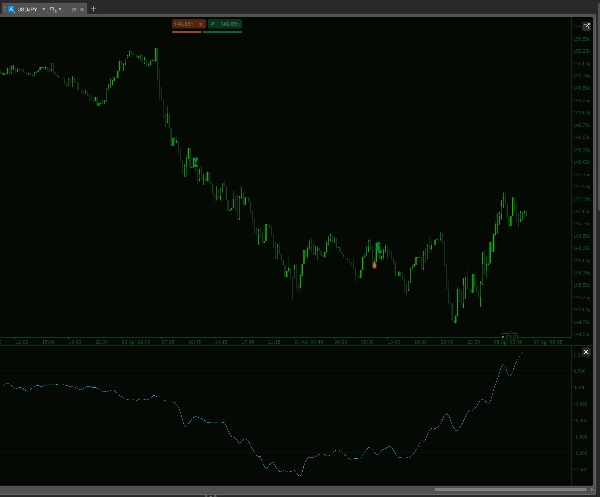
Eleve sua estratégia de negociação com o Indicador Histórico DXY HMA—uma ferramenta avançada do cTrader projetada para precisão e desempenho. Este indicador avançado calcula um Índice do Dólar Americano personalizado combinando as variações percentuais ponderadas de seis pares de moedas principais, fornecendo a você uma medida de mercado dinâmica e confiável.
Principais Características:
- Cálculo Personalizado do DXY: Integra seis pares principais do USD (EURUSD, USDJPY, GBPUSD, USDCAD, USDCHF, USDSEK) com pesos configuráveis para um índice finamente ajustado.
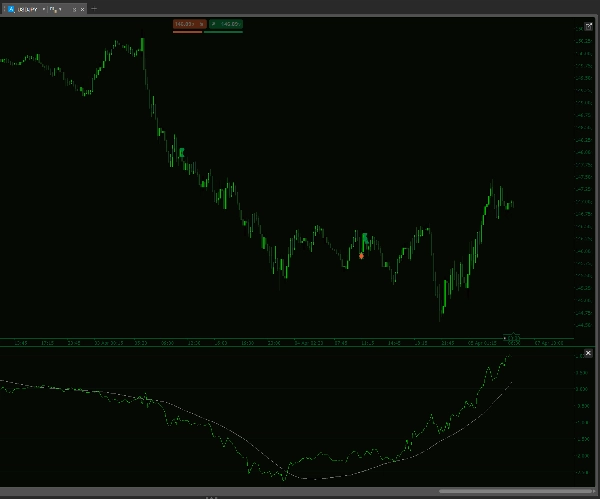
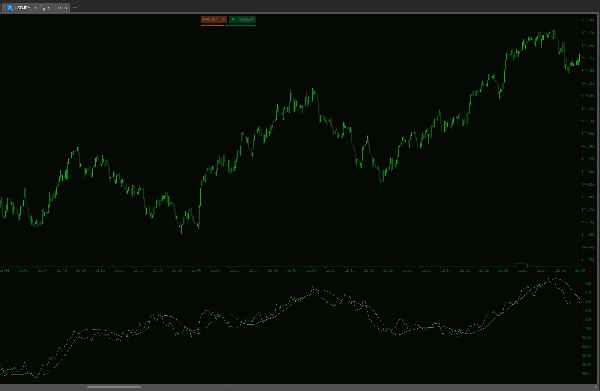
- Médias Móveis Hull Duplas: Utiliza médias móveis Hull de períodos curtos e longos para oferecer uma visão clara das tendências e do momentum do mercado.
- Suavização da Inclinação: Melhora a detecção de tendências com uma inclinação HMA suavizada, dando a você uma vantagem na identificação de reversões de mercado.
- Manipulação Robusta de Dados: Sincroniza perfeitamente com sua plataforma cTrader, garantindo análise precisa em tempo real mesmo ao lidar com fontes de dados variadas.
- Parâmetros Personalizáveis: Ajuste fino das contagens de lookback e períodos das médias móveis para combinar perfeitamente com seu estilo de negociação e condições de mercado.
Projetado com o trader moderno em mente, o Indicador Histórico DXY HMA simplifica dados complexos do mercado em insights acionáveis, permitindo que você tome decisões de negociação mais inteligentes e confiantes. Experimente o próximo nível de análise de mercado!
--------------------------
Sinta-se à vontade para conferir meus outros indicadores!
https://ctrader.com/products/1181
https://ctrader.com/products/1182
https://ctrader.com/products/1180
https://ctrader.com/products/1015
https://ctrader.com/products/555
https://ctrader.com/products/553
https://ctrader.com/products/554
https://ctrader.com/products/552
https://ctrader.com/products/557
https://ctrader.com/products/845
https://ctrader.com/products/848
https://ctrader.com/products/847
https://ctrader.com/products/846
https://ctrader.com/products/551
https://ctrader.com/products/574
https://ctrader.com/products/573
https://ctrader.com/products/556
https://ctrader.com/products/558
https://ctrader.com/products/559
https://ctrader.com/products/560


