
Candles_Painter
Indicateur
3 achats
Version 1.0, Aug 2025
Windows, Mac
5.0
Avis : 2
Depuis le 26/05/2025
449.3M
Volume tradé
61.1K
Pips gagnés
15
Ventes
1.43K
Installations gratuites
Description
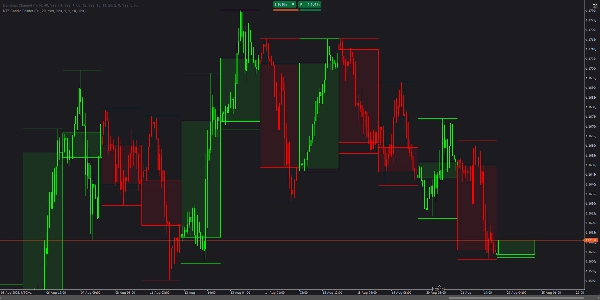
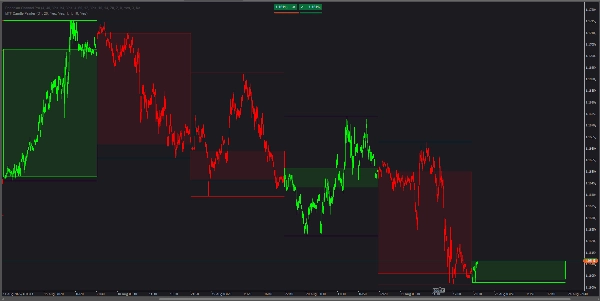
MTF Candle Painter superpose le contexte de la période supérieure (HTF) directement sur votre graphique actuel. Il colore chaque barre sur la période active selon la direction de la bougie HTF englobante et dessine un rectangle de corps HTF rempli (ouverture-fermeture uniquement, sans mèches) ainsi que des lignes optionnelles HTF Haut/Bas. Des couleurs distinctes pour haussier/baissier et une opacité de remplissage ajustable offrent un biais clair et lisible en un coup d'œil.
Caractéristiques principales
- Coloration multi-périodes : toutes les barres à l'intérieur d'une bougie HTF héritent de sa couleur haussière/baissière.
- Superposition du corps HTF : rectangle entre l'ouverture et la fermeture HTF ; pas de mèche centrale pour plus de clarté.
- Style distinct pour haussier/baissier : couleurs indépendantes pour le contour et le remplissage des bougies HTF haussières et baissières.
- Opacité ajustable : réglez la transparence du remplissage (10 % par défaut) pour un empilement propre avec le prix.
- Lignes HTF Haut/Bas : optionnelles, avec épaisseur configurable.
- Contrôle du recul : choisissez combien de bougies HTF récentes afficher (20 par défaut).
- Léger : utilise des objets natifs du graphique ; rapide et discret.
Paramètres
Noyau
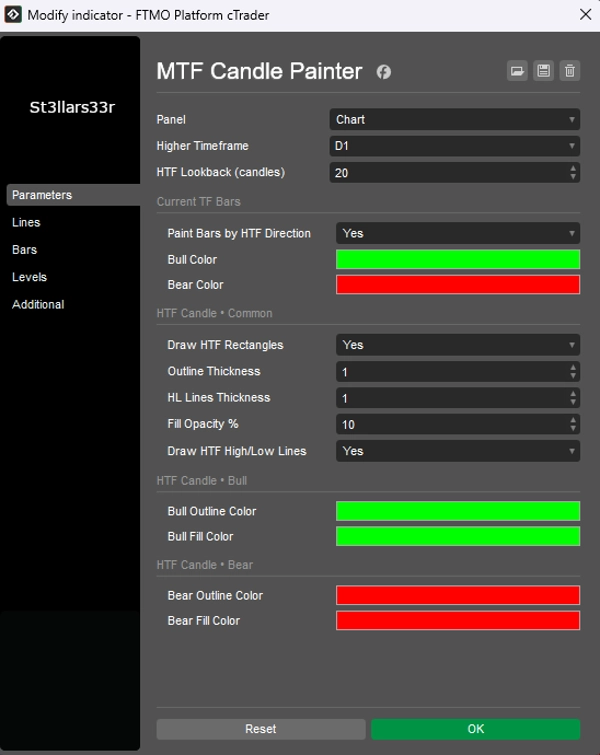
Higher Timeframe– HTF à superposer (par ex., D1, H4, W1).HTF Lookback (candles)– nombre de bougies HTF à dessiner (par défaut 20).
Barres de la période actuelle
Paint Bars by HTF Direction– colorer les barres de la période actuelle selon la bougie HTF englobante (Oui/Non).Bull Color/Bear Color– couleurs pour les barres de la période actuelle.
Bougie HTF • Commun
Draw HTF Rectangles– afficher les rectangles du corps HTF (par défaut Oui).Outline Thickness– épaisseur du contour du corps HTF.HL Lines Thickness– épaisseur des lignes HTF Haut/Bas.Fill Opacity %– transparence du remplissage du corps HTF (par défaut 10%).Draw HTF High/Low Lines– activer/désactiver les lignes HTF Haut/Bas (Oui/Non).
Bougie HTF • Haussier
Bull Outline Color– couleur du contour pour les bougies HTF haussières.Bull Fill Color– couleur de remplissage pour les bougies HTF haussières.
Bougie HTF • Baissier
Bear Outline Color– couleur du contour pour les bougies HTF baissières.Bear Fill Color– couleur de remplissage pour les bougies HTF baissières.
Pour qui c’est
- Les traders intrajournaliers et scalpers qui ont besoin d’un biais HTF continu sans changer de graphique.
- Les praticiens SMC/Wyckoff qui s’appuient sur la structure des périodes supérieures tout en opérant sur des périodes inférieures.
- Toute personne souhaitant un contexte HTF clair et visuel superposé à sa période de travail.
Résumé
Résumé IA
Candles_Painter is a multi-timeframe indicator designed to overlay higher timeframe (HTF) candle context onto a lower timeframe chart. It visually colors each bar on the active timeframe according to the bullish or bearish direction of the enclosing HTF candle. The indicator draws filled rectangles representing the HTF candle bodies (open to close, excluding wicks) with customizable fill opacity and separate colors for bullish and bearish candles. Optional HTF high and low lines can also be displayed with adjustable thickness.
Key features include:
- Coloring of all bars within an HTF candle by its direction.
- HTF body overlays for clear visual bias.
- Independent styling for bullish and bearish HTF candles.
- Adjustable transparency for neat integration with price data.
- Configurable lookback period for the number of HTF candles shown.
- Lightweight implementation using native chart objects for performance.
Users can customize parameters such as the higher timeframe to overlay (e.g., daily, 4-hour), colors for bars and HTF candles, opacity, and whether to display HTF high/low lines. This tool is suited for intraday traders, scalpers, and market structure practitioners who require continuous HTF context without switching charts.
Profil de l'indicateur
Avis clients
5.0
Avis : 2
5 | 100 % | |
4 | 0 % | |
3 | 0 % | |
2 | 0 % | |
1 | 0 % |
Avis clients
September 1, 2025
The log becomes easier to read, but a manual check is still part of the process.
August 27, 2025
A few ugly trades are useful in the sample, and it makes the setup easier to question.
Discussion
Questions fréquentes
Les produits disponibles sur cTrader Store, notamment les bots de trading, les indicateurs et les plug-ins, sont fournis par des développeurs tiers et mis à disposition à titre informatif et à des fins d'accès technique uniquement. cTrader Store n'est pas un courtier et ne fournit aucun conseil en investissement, aucune recommandation personnelle ni aucune garantie quant aux performances futures.


![Logo de "[Hamster-Coder] Moving Average MTF"](https://cdn.ctrader.com/image/webp/b11b98b1-194d-4b8e-b00e-d611826ad159_31226)
Prix
Depuis le 26/05/2025
449.3M
Volume tradé
61.1K
Pips gagnés
15
Ventes
1.43K
Installations gratuites