
Market Entropy
Indicateur
107 téléchargements
Version 1.0, Aug 2025
Windows, Mac
Depuis le 26/05/2025
449.3M
Volume tradé
61.1K
Pips gagnés
15
Ventes
1.43K
Installations gratuites
Description
Market Entropy est un indicateur double (oscillateur + superposition de prix optionnelle) qui quantifie l'organisation du marché et signale les changements de régime à travers Ordre → Transition → Chaos. Il ajoute une seconde ligne, Trendness (DC), pour séparer la vraie tendance de la compression de volatilité.
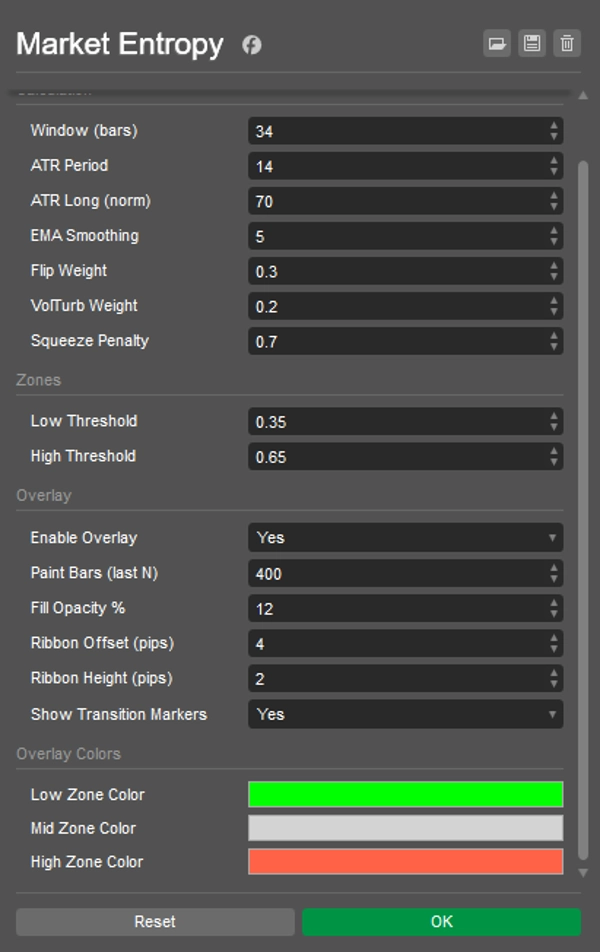
Comment ça fonctionne :
- Utilise uniquement les composants OHLCV : DC (cohérence directionnelle), FlipRate (inversions de signe), Volatility_n (ATR/ATRlong), VolumeTurb (écart-type de ΔVolume).
- Entropie brute :
E0 = 0.5*(1-DC) + 0.3*(FlipRate*VolN) + 0.2*VolumeTurb). - Le terme anti-compression réduit E pendant les compressions ATR → entropie finale ∈ [0..1] avec lissage EMA.
- Marqueurs :
-
- CRYSTAL — croisement en dessous de LowThr (l'ordre émerge : tendance ou compression pré-rupture).
- DISSOLVE — croisement au-dessus de HighThr (l'ordre se brise : chaos/décroissance de la tendance).
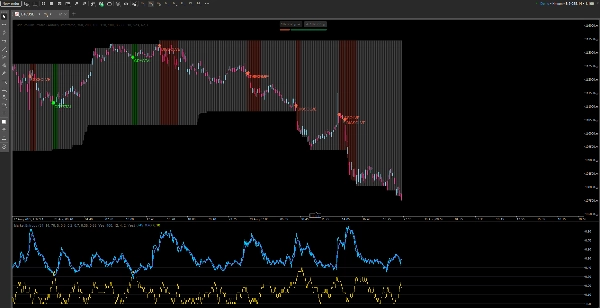
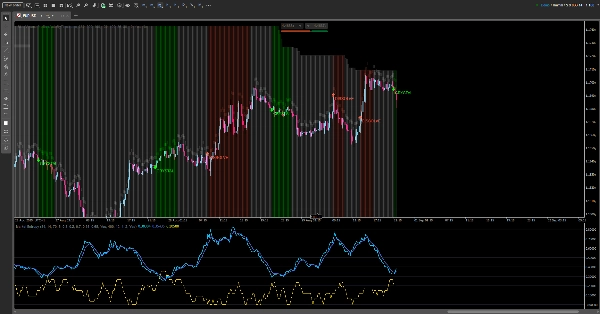
Ce que vous voyez :
- Dans le panneau : Entropy, Entropy(EMA), Trendness (DC), seuils bas/hauts, fond de zone.
- Sur le graphique (activable) : barres colorées selon l'état, un ruban fin au-dessus des plus hauts, et marqueurs CRYSTAL/DISSOLVE.
Guide de lecture :
- E < LowThr → Ordre :
-
- avec DC élevé → tendance organisée ;
- avec ATR faible → compression (rupture attendue).
- LowThr…HighThr → Transition : structure en formation ; attendre la résolution.
- E > HighThr → Chaos : incertitude / usure de la tendance ; éviter les entrées naïves en continuation.
Stratégies :
- Compression → CRYSTAL → Rupture/Retest — trader la cassure.
- Tendance → DISSOLVE — réduire la position ou resserrer le risque.
Résumé
Profil de l'indicateur
Avis clients
0.0
Avis : 0
Avis clients
Il n'y a pas encore d'avis sur ce produit. Vous l'avez déjà essayé ? Soyez le premier à en parler aux autres !
Discussion
Questions fréquentes
Les produits disponibles sur cTrader Store, notamment les bots de trading, les indicateurs et les plug-ins, sont fournis par des développeurs tiers et mis à disposition à titre informatif et à des fins d'accès technique uniquement. cTrader Store n'est pas un courtier et ne fournit aucun conseil en investissement, aucune recommandation personnelle ni aucune garantie quant aux performances futures.


Prix
Depuis le 26/05/2025
449.3M
Volume tradé
61.1K
Pips gagnés
15
Ventes
1.43K
Installations gratuites