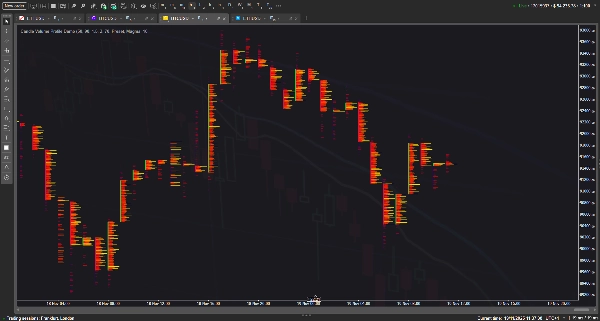
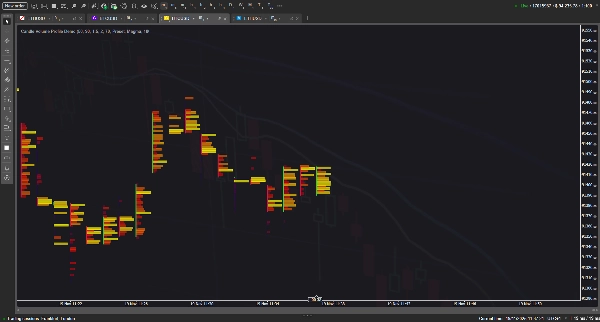
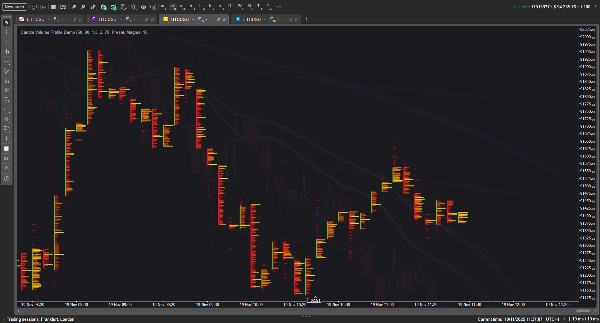
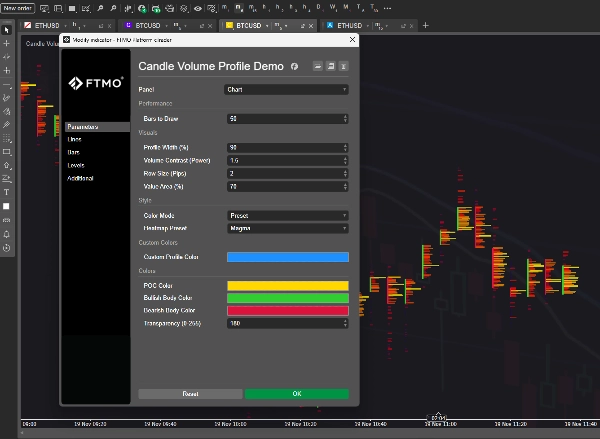
Candle Volume Profile Demo
Indicateur
280 téléchargements
Version 1.0, Nov 2025
Windows, Mac
4.0
Avis : 1
Image mise en ligne de "Candle Volume Profile Demo"Image mise en ligne de "Candle Volume Profile Demo"Image mise en ligne de "Candle Volume Profile Demo"Image mise en ligne de "Candle Volume Profile Demo"
Depuis le 26/05/2025
338.57M
Volume tradé
59.27K
Pips gagnés
11
Ventes
978
Installations gratuites

This indicator visualizes the Volume Profile for individual bars, transforming standard candlesticks into a detailed 'footprint' style chart with customizable heatmaps, Point of Control (POC) lines, and Value Area blocks to highlight volume distribution per price level. It aims to emulate professional order flow tools by using heuristic volume distribution to render market activity directly on the chart.

Theoretically, this concept should work seamlessly to provide deep market insights; however, in practice, due to the immense number of graphical objects required for rendering, the more features and history depth you demand from this indicator, the more it tends to lag and cause terminal instability. :(

4.0
Avis : 1
5
0 %
4
100 %
3
0 %
2
0 %
1
0 %
Avis clients
November 24, 2025
Candle Volume Profile Demo gives you a clean visual of volume distribution inside candles/ranges - a smart add-on for liquidity-aware traders. The visualization is sharp and performance solid, but as a demo version it lacks full features (history logs, advanced filters). Best when paired with structure and confirmation tools. A good starting point, ready to level up.
VWAP
ZigZag
FVG
ATR
Signal
Crypto
BTCUSD

Plus de cet auteur

Indicateur
NAS100
Indices
+7
Heatmap of intra-HTF volume (POC/VA) built from LTF tick data; paints current candle and auto-loads visible history.
Indicateur
NAS100
NZDUSD
+14
Right-anchored cTrader Volume Profile with VAH/VAL/POC, LVZ, top volume+EMA, themes, and fast, readable visuals.
Indicateur
NAS100
NZDUSD
+13
Pro VSA tool with 3 modes: Fixed Ratios, Standard Deviation & Contextual VSA.
Overlay HTF context on any chart: color bars by HTF and draw filled HTF bodies with optional High/Low lines.
10 configurable moving averages: choose type, period, color per line; single price source for all.
Indicateur
NAS100
NZDUSD
+20
Session boxes, liquidity sweeps and higher‑timeframe levels for intraday trading
Market entropy + DC. Spot crystallization/chaos shifts with an optional on-chart overlay.
Edge-aware clouds + Pro HUD: better entries, calmer exits, adaptive risk.
Indicateur
NAS100
NZDUSD
+17
A multi-TF panel with candle timers, sessions, ticker, spread & 15+ themes. Fully customizable.
Indicateur
NAS100
NZDUSD
+15
Tracks N-period highs/lows, HTF overlay, HUDs with ADX, RSI, session clocks. Customizable for precise trading.

Vous pourriez aussi aimer

Indicateur
Indices
Commodities
+1
Visualize higher timeframe candles directly on your current chart. Display up to 3 higher timeframe panels with OHLC
Indicateur
NAS100
NZDUSD
+15
Engulfing Candle Indicator Pro
Indicateur
Grid
Indices
+4
A free institutional-style chart tool that maps key daily liquidity levels in a clean H Capital interface.
Indicateur
NAS100
NZDUSD
+26
Smart Money Heat Dashboard Pro is a professional-grade cTrader / cAlgo indicator designed to help traders read markets.
Indicateur
Grid
NAS100
+6
RiskLotSizer is a practical risk management indicator for cTrader that helps traders calculate lot size based on a chose
Indicateur
NAS100
Indices
+7
Multi-timeframe moving averages with session lines for structured trend analysis directly on the chart.
Indicateur
Grid
NAS100
+19
Fixed Range Volume Profile - TradingView Style (POC, VAH, VAL)
Indicateur
NAS100
NZDUSD
+7
Trading Concept Suite: OBs, FVGs, Structure, Liquidity, Killzones & MTF overlay. Every concept in one cTrader indicator.
Indicateur
NAS100
NZDUSD
+6
DailyLossGuard is a simple and practical cTrader indicator that monitors your total daily P/L in real time. It combines
Indicateur
NAS100
NZDUSD
+26
Fair Value Gap Stategy with Signals
Indicateur
NAS100
NZDUSD
+8
ECONEWS LIVE: Premium economic calendar for cTrader. Real-time, vertical event lines & news ticker.
Indicateur
VWAP
NAS100
+7
VWAP + Swing Liquidity + SFP Signals — detects liquidity sweeps with color-coded alerts.
Depuis le 26/05/2025
338.57M
Volume tradé
59.27K
Pips gagnés
11
Ventes
978
Installations gratuites