
Zero Lag Exponential Moving Average
Chỉ báo
259 lượt tải
Phiên bản 1.0, Aug 2025
Windows, Mac
Mô tả
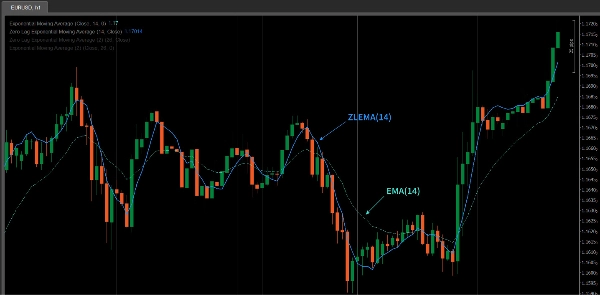
The ZLEMA (Zero Lag Exponential Moving Average) là một phiên bản nâng cao của Đường Trung Bình Động Lũy Thừa (EMA) được thiết kế để giảm độ trễ thường gặp ở các EMA truyền thống. Bằng cách sử dụng phương pháp tính toán chuyên biệt, ZLEMA phản ứng nhanh hơn với các biến động giá, làm cho nó đặc biệt hiệu quả trong các thị trường biến động.
Đặc điểm chính của ZLEMA là tính "độ trễ bằng không", cho phép nó theo sát các chuyển động giá hơn, đặc biệt trong điều kiện thị trường biến động nhanh. So với EMA truyền thống, ZLEMA cung cấp thời gian phản hồi nhanh hơn, giúp nắm bắt xu hướng thị trường kịp thời hơn.
ZLEMA vs EMA
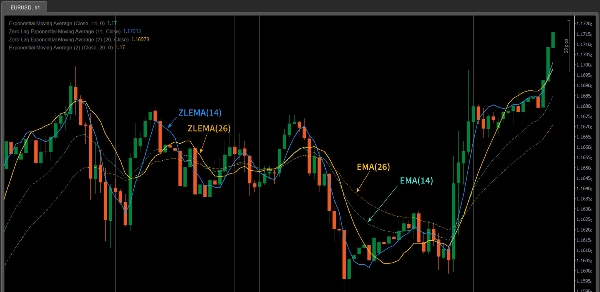
- Tốc Độ Phản Ứng: ZLEMA phản ứng nhanh hơn EMA truyền thống. Bằng cách bù đắp độ trễ, nó theo kịp các biến động giá một cách nhanh chóng hơn.
- Hiệu Ứng Làm Mượt: ZLEMA duy trì hiệu ứng làm mượt tương tự như EMA, đồng thời giảm thiểu độ trễ giá, làm cho nó phù hợp hơn với các thị trường biến động nhanh.
- Trường Hợp Sử Dụng: Nếu bạn giao dịch trong thị trường có biến động cao (như giao dịch ngắn hạn hoặc trong ngày), ZLEMA có thể vượt trội hơn EMA về khả năng phản ứng.
Các Tính Năng của Chỉ Báo ZLEMA
- Phản Ứng Độ Trễ Bằng Không: ZLEMA giảm độ trễ, cho phép nó phản ứng nhanh với các biến động giá trên thị trường, làm cho nó chính xác hơn trong việc nắm bắt các thay đổi nhanh chóng của thị trường.
- Độ Mượt: Mặc dù cung cấp khả năng phản ứng nhanh hơn, ZLEMA vẫn giữ được hiệu ứng làm mượt của EMA, giúp tránh nhiễu do biến động giá gây ra.
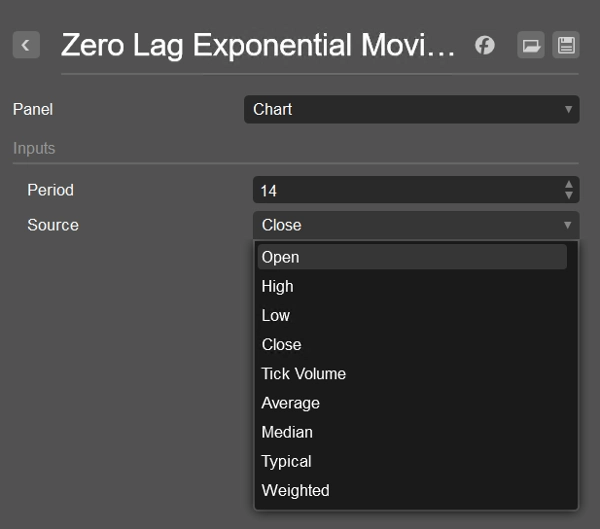
- Tính Linh Hoạt: ZLEMA có thể được sử dụng với các nguồn dữ liệu giá khác nhau (như
Close,Open,High, v.v.), cho phép các nhà giao dịch điều chỉnh theo nhu cầu chiến lược của họ. - Theo Dõi Xu Hướng và Xác Nhận Tín Hiệu Đảo Chiều: ZLEMA lý tưởng để nhận diện sự thay đổi xu hướng, đặc biệt trong các thị trường biến động, và xác nhận các tín hiệu đảo chiều giá.
Cách Sử Dụng Chỉ Báo ZLEMA
- Nhà Giao Dịch Ngắn Hạn: ZLEMA rất phù hợp cho các nhà giao dịch ngắn hạn vì nó có thể phản ứng nhanh với các biến động giá. Phản ứng nhanh của nó làm cho nó lý tưởng để nắm bắt các đảo chiều xu hướng ngắn hạn hoặc tín hiệu bứt phá.
- Theo Dõi Xu Hướng: ZLEMA cũng có thể được sử dụng để theo dõi các xu hướng dài hạn nhưng nhạy hơn EMA. Trong một xu hướng mạnh, ZLEMA giúp nhận biết sự bắt đầu hoặc kết thúc của xu hướng nhanh hơn, hỗ trợ điều chỉnh chiến lược kịp thời.
- Kết Hợp Với Các Chỉ Báo Khác: ZLEMA hoạt động tốt khi kết hợp với các chỉ báo kỹ thuật khác như RSI, MACD hoặc phân tích mô hình giá để tăng độ chính xác tín hiệu. Nó đặc biệt hữu ích khi kết hợp với các chỉ báo theo xu hướng như đường trung bình động để xác nhận các bứt phá hoặc đảo chiều giá.
- Xác Nhận Bứt Phá và Đảo Chiều: ZLEMA có thể giúp xác nhận các bứt phá giá từ các mức quan trọng hoặc tín hiệu đảo chiều. Ví dụ, khi giá cắt qua đường ZLEMA, điều đó có thể báo hiệu sự thay đổi xu hướng, và ngược lại.
- Giảm Nhiễu: Do giảm độ trễ, ZLEMA tốt hơn trong việc lọc bỏ nhiễu có thể có trong các đường trung bình động truyền thống, làm cho nó trở thành công cụ quan trọng trong giao dịch trong ngày hoặc các thị trường biến động cao.
Mẹo Sử Dụng ZLEMA
- Điều Chỉnh Chu Kỳ: Điều chỉnh chu kỳ của ZLEMA dựa trên phong cách giao dịch và độ biến động của thị trường. Đối với giao dịch ngắn hạn, sử dụng chu kỳ ngắn hơn (ví dụ: 10 hoặc 14), trong khi theo dõi xu hướng dài hạn, chu kỳ dài hơn (ví dụ: 50 hoặc 100) có thể phù hợp hơn.
- Kết Hợp Với Các Công Cụ Khác: Mặc dù ZLEMA cung cấp khả năng theo dõi xu hướng xuất sắc, kết hợp nó với các chỉ báo khác như RSI để xác định điều kiện mua quá mức/bán quá mức hoặc MACD để đánh giá sức mạnh xu hướng có thể cải thiện độ chính xác.
- Kiểm Tra và Tối Ưu: Hiệu suất của ZLEMA có thể thay đổi theo các điều kiện thị trường khác nhau. Nên kiểm tra lại và tối ưu kỹ lưỡng trước khi sử dụng trong giao dịch thực để đảm bảo kết quả tốt nhất cho chiến lược của bạn.
Tóm tắt
Tóm tắt AI
The Zero Lag Exponential Moving Average (ZLEMA) is an advanced technical indicator designed to improve upon the traditional Exponential Moving Average (EMA) by reducing lag. It achieves faster response times to price changes while maintaining the smoothing effect of EMA, making it suitable for capturing quick market shifts and trends, especially in volatile or fast-moving markets.
Key features include:
- Zero lag response for timely reaction to price fluctuations.
- Smoothness that filters out noise without sacrificing responsiveness.
- Flexibility to use various price data inputs such as Close, Open, or High prices.
- Utility in trend following and confirming reversal signals.
ZLEMA is particularly useful for short-term traders seeking to capture rapid trend reversals or breakouts, as well as for longer-term trend tracking with enhanced sensitivity compared to EMA. It can be combined with other indicators like RSI or MACD to improve signal accuracy and confirm price breakouts or reversals.
Users can adjust the indicator’s period to match their trading style and market conditions, optimizing performance through backtesting. ZLEMA helps reduce noise and lag, making it a valuable tool for intraday and volatile market trading.
Hồ sơ chỉ báo
Đánh giá của khách hàng
0.0
Đánh giá: 0
Đánh giá của khách hàng
Sản phẩm này chưa có đánh giá nào. Bạn đã dùng thử chưa? Hãy là người đầu tiên chia sẻ với mọi người!
Thảo luận
Câu hỏi thường gặp
Các sản phẩm có sẵn trên cTrader Store, bao gồm bot giao dịch, chỉ báo và plugin, được cung cấp bởi các nhà phát triển bên thứ ba và chỉ nhằm mục đích cung cấp thông tin và tiếp cận kỹ thuật. cTrader Store không phải là nhà môi giới và không cung cấp lời khuyên đầu tư, khuyến nghị cá nhân hay bất kỳ đảm bảo nào về hiệu suất trong tương lai.


Giá
Kể từ 14/07/2025
259
Cài đặt miễn phí