
Description
Comment trader en utilisant la stratégie Donchian (Breakout)
- Acheter lorsque le prix dépasse le plus haut sur N périodes (Supérieur).
- Vendre lorsque le prix dépasse le plus bas sur N périodes (Inférieur).
- Maintenir la position tant que la tendance continue ; sortir lors d'une cassure opposée ou via un stop suiveur.
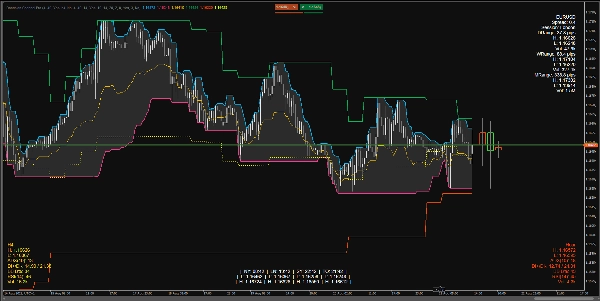
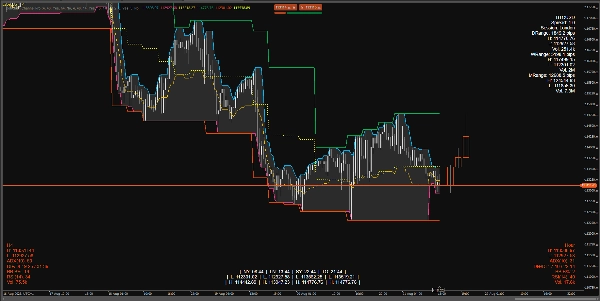
Ce que l'indicateur affiche sur le graphique
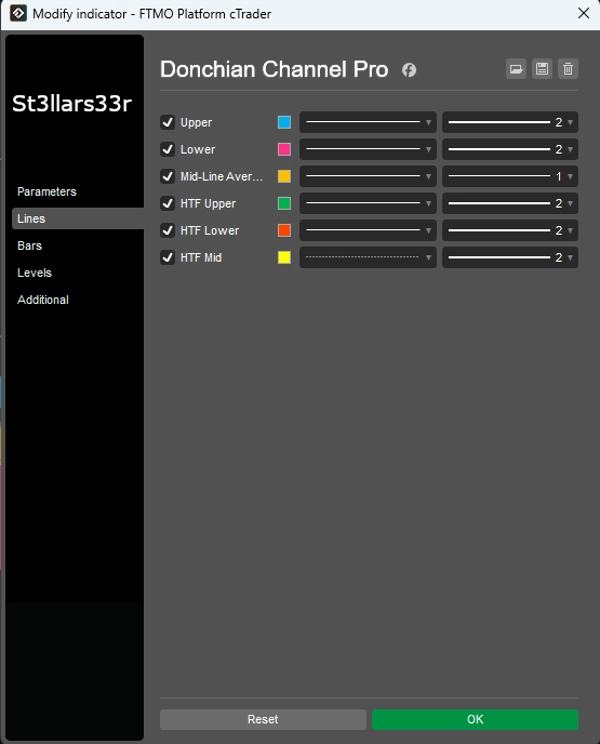
Donchian sur la période actuelle (TF) :
- Supérieur : Le prix le plus élevé sur les barres du canal supérieur.
- Inférieur : Le prix le plus bas sur les barres du canal inférieur.
- Milieu : Le point médian entre le supérieur et l'inférieur.
Superposition HTF : Lignes Donchian d'une période supérieure superposées sur le graphique :
- HTF Supérieur, HTF Inférieur, HTF Milieu
- HTF Candles HUD : Rectangles représentant les chandeliers de la période supérieure, ancrés à droite de la dernière barre sur la période actuelle.
HUDs (affichages tête haute) en bas/en haut :
- TopRight : Panneau d'information pour le symbole + plages journalières/hebdomadaires/mensuelles.
- BottomLeft : HUD HTF (métriques pour la période supérieure).
- BottomRight : HUD TF intermédiaire (métriques pour la période intermédiaire).
- BottomMid : Horloges de session + Haut/Bas pour chaque session (persistant).
Ce que chaque HUD affiche
TopRight (en haut à droite)
- NomSymbole
- Spread : Spread en pips.
- Session : Session active actuelle (basée sur les heures spécifiées).
- DRange/WRange/MRange : Plage journalière/hebdomadaire/mensuelle en pips.
- H/L/Vol : Haut/Bas et volume total pour la période respective.
BottomLeft (en bas à gauche) — HUD HTF
- Nom TF (ex. H4, D1, etc.)
- H/L : Haut/bas actuel de la dernière barre HTF (ou active).
- ADX(n), DI+/DI- : Indicateurs de tendance.
- BB B% : Position du prix actuel par rapport aux bandes de Bollinger sur HTF (0 près de la bande inférieure, 100 près de la bande supérieure).
- RSI(n)
- Vol : Volume sur HTF.
- Couleur HUD :
-
- Vert : Plage s'élargissant vers le haut (DI+ et ADX en hausse).
- Rouge : Pression à la baisse croissante (DI- en hausse).
- Jaune : Neutre/indéfini.
BottomRight (en bas à droite) — HUD TF intermédiaire
- Identique au HUD HTF, mais pour la période intermédiaire (TF intermédiaire).
BottomMid (centre bas) — Horloges + Haut/Bas de session
- Heure à NY, LN, SY, TO.
- B/H pour chaque session.
- Logique persistante : Lorsqu'une session est inactive, affiche le H/B de la dernière session terminée ; lorsqu'une nouvelle session commence, les valeurs sont réinitialisées et recalculées.
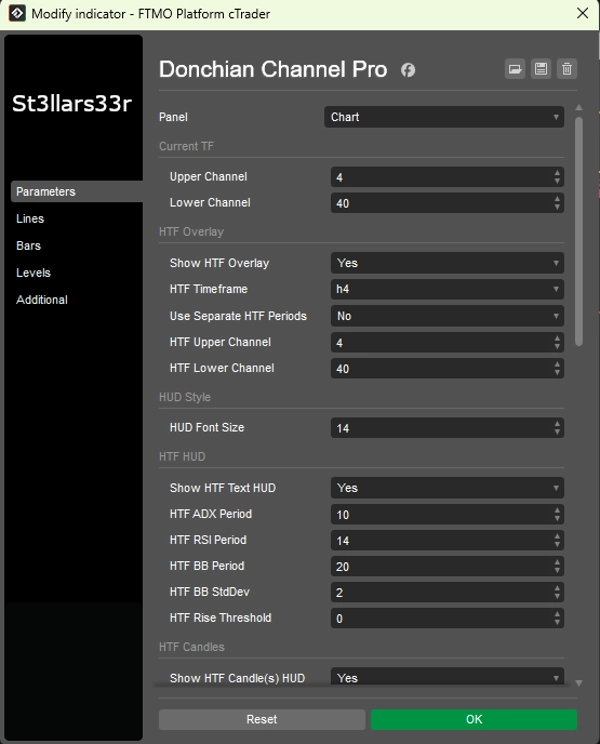
Paramètres et comment les utiliser
Groupe : TF actuel (Donchian actuel)
- Canal supérieur : Nombre de barres pour le canal supérieur. Valeur plus grande = mises à jour moins fréquentes, ligne plus plate.
- Canal inférieur : Nombre de barres pour le canal inférieur.
Groupe : Superposition HTF (Superposition Donchian période supérieure)
- Afficher la superposition HTF : Active les lignes HTF sur le graphique.
- Période HTF : Sélectionner la période supérieure (ex. Hour4).
- Utiliser des périodes HTF séparées : Si vrai, HTF Supérieur/Inférieur utilise ses propres paramètres ; sinon, utilise Supérieur/Inférieur actuel.
- Canal supérieur HTF : Longueur du canal supérieur pour HTF.
- Canal inférieur HTF : Longueur du canal inférieur pour HTF.
Groupe : Style HUD
- Taille de police HUD : Taille de police pour tous les HUD (TopRight, BottomLeft, BottomRight, BottomMid).
Groupe : HUD HTF (en bas à gauche)
- Afficher HUD texte HTF : Afficher le HUD texte pour HTF.
- Période ADX HTF : Période ADX/DI. Plus grande = plus lisse, moins de bruit, mais réponse plus lente.
- Période RSI HTF : Période RSI.
- Période BB HTF : Période des bandes de Bollinger.
- Écart-type BB HTF : Multiplicateur d'écart-type pour BB (classique est 2.0).
- Seuil de montée HTF : Sensibilité aux métriques en hausse (affecte la couleur du HUD).
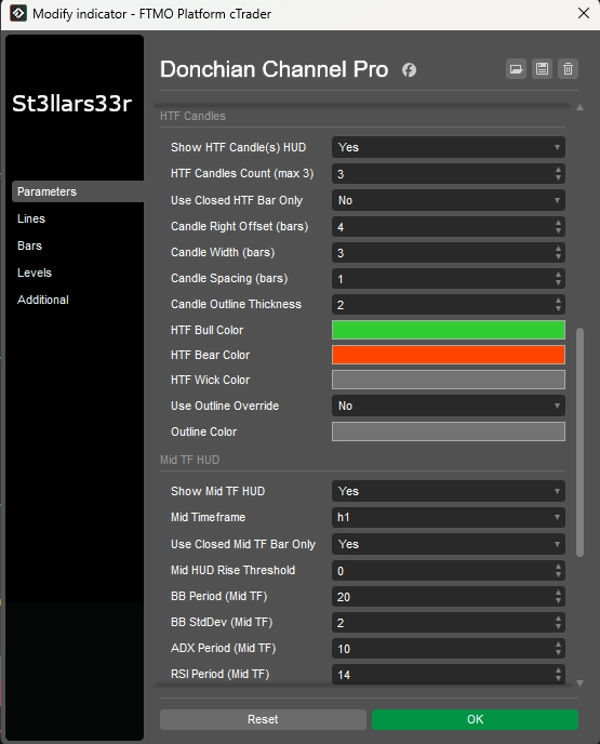
Groupe : Chandeliers HTF (droite, près de la dernière barre)
- Afficher HUD chandelier(s) HTF : Afficher les chandeliers HTF à droite.
- Nombre de chandeliers HTF (max 3) : Nombre de chandeliers HTF (1–3).
- Utiliser uniquement barre HTF fermée : Si vrai, utilise uniquement les chandeliers HTF fermés (valeurs stables). Sinon, inclut le chandelier ouvert actuel.
- Décalage chandelier à droite (barres) : Décalage vers la droite en barres de la période actuelle depuis la dernière barre (ancre).
- Largeur chandelier (barres) : Largeur du rectangle du chandelier en barres de la période actuelle.
- Espacement chandeliers (barres) : Espace entre les chandeliers.
- Épaisseur contour chandelier : Épaisseur des contours des chandeliers.
- Couleur haussière HTF / Couleur baissière HTF : Couleurs pour chandeliers haussiers/baissiers.
- Couleur mèche HTF : Couleur des mèches.
- Utiliser remplacement contour : Si vrai, le corps du chandelier est dessiné avec un contour (couleur contour) sans remplissage haussier/baissier.
- Couleur contour : Couleur du contour lorsque Utiliser remplacement contour = vrai.
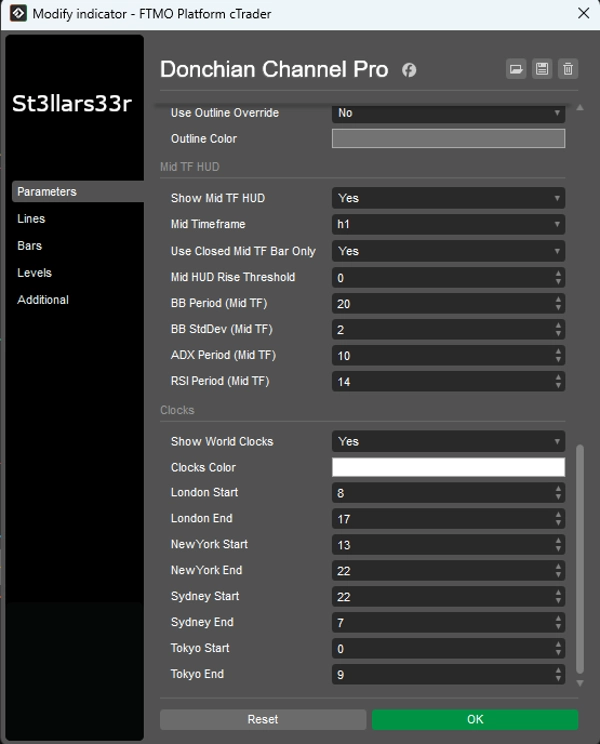
Groupe : HUD TF intermédiaire (en bas à droite)
- Afficher HUD TF intermédiaire : Active le HUD pour la période intermédiaire.
- Période intermédiaire : Sélectionner la période intermédiaire (ex. Minute15).
- Utiliser uniquement barre TF intermédiaire fermée : Idem que HTF, mais pour TF intermédiaire.
- Seuil de montée HUD intermédiaire : Sensibilité de couleur pour le HUD TF intermédiaire.
- Période BB (TF intermédiaire), Écart-type BB (TF intermédiaire) : Paramètres des bandes de Bollinger pour TF intermédiaire.
- Période ADX (TF intermédiaire), Période RSI (TF intermédiaire) : Périodes ADX et RSI pour TF intermédiaire.
Groupe : Horloges (centre bas)
- Afficher horloges mondiales : Afficher le bloc avec horloges et H/B des sessions.
- Couleur horloges : Couleur du texte pour horloges/sessions.
- Début Londres / Fin Londres : Heures de début/fin pour la session de Londres.
- Début NewYork / Fin NewYork : Pour New York.
- Début Sydney / Fin Sydney : Pour Sydney.
- Début Tokyo / Fin Tokyo : Pour Tokyo.
Horloges : Affiche l'heure locale réelle pour les villes (via les fuseaux horaires du système d'exploitation avec un décalage de secours).
- Les calculs d'activité de session (et H/B) utilisent l'heure du serveur du courtier (Server.Time). Si le serveur n'est pas en UTC, les heures de session peuvent décaler — ajustez Début/Fin selon votre serveur.
- Si une session traverse minuit (Fin < Début), l'indicateur prend automatiquement en compte la transition de date.
- Lorsqu'une session est inactive, le H/B de la dernière session terminée est affiché ; lorsqu'une nouvelle session commence, les données sont réinitialisées et recalculées.
Résumé
Avis clients
5 | 50 % | |
4 | 50 % | |
3 | 0 % | |
2 | 0 % | |
1 | 0 % |


