Description
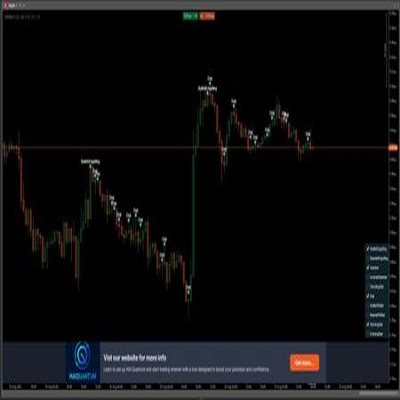
L'indice de pression des chandeliers (CPI) est un indicateur puissant mais facile à utiliser, conçu pour révéler la pression cachée d'achat et de vente derrière chaque chandelier. Au lieu de simplement montrer si le prix a monté ou baissé, le CPI creuse plus profondément pour montrer à quel point les acheteurs ou les vendeurs ont contrôlé le marché à l'intérieur de chaque chandelier. Cela en fait un outil unique pour identifier la force de la tendance, repérer les retournements tôt et confirmer les points d'entrée ou de sortie avec une plus grande précision.
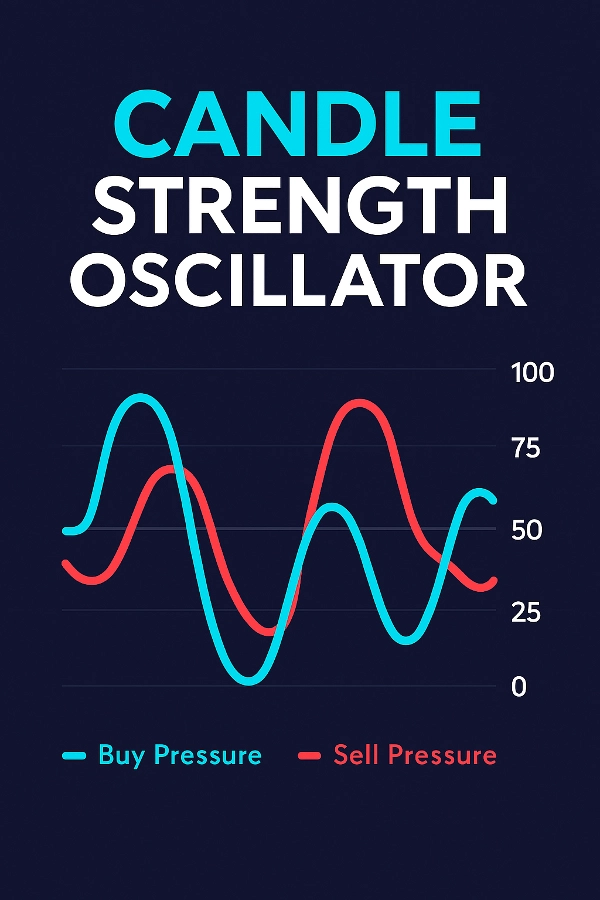
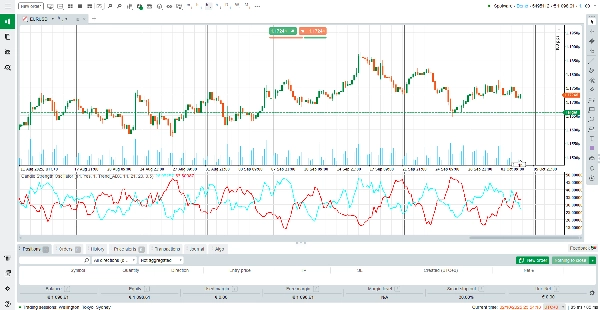
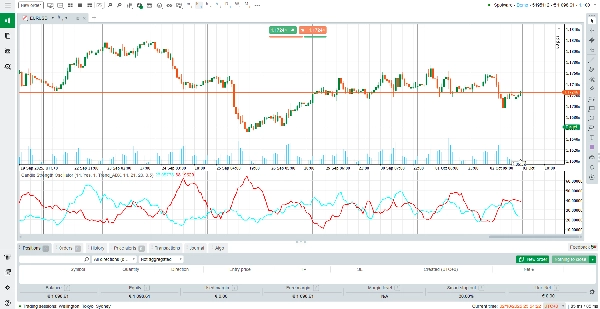
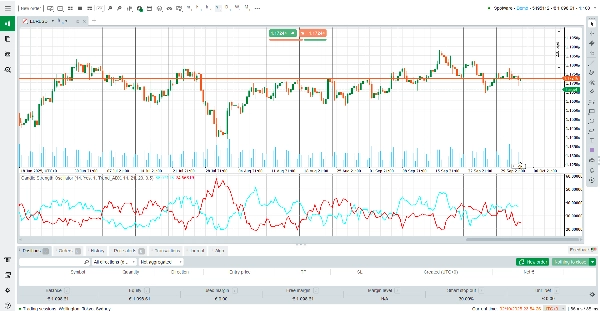
Contrairement aux oscillateurs traditionnels qui ne réagissent qu'au prix, le CPI combine la dynamique du corps du chandelier, le momentum, la pondération du volume et l'analyse de tendance (ADX ou EMA) pour vous offrir une vue complète de la pression du marché. Avec deux lignes lisses – Pression d'achat (cyan) et Pression de vente (rouge) – les traders peuvent instantanément voir quel côté du marché est en contrôle.
Comment lire l'indicateur
Pression d'achat (ligne cyan) – Représente l'intensité du contrôle haussier. Une ligne ascendante montre une domination croissante des acheteurs.
Pression de vente (ligne rouge) – Représente l'intensité du contrôle baissier. Une ligne ascendante montre une force de vente plus forte.
Croisements – Lorsque la ligne d'achat croise au-dessus de la ligne de vente, cela signale une pression haussière plus forte (opportunité d'achat potentielle). Lorsque la ligne de vente croise au-dessus, la pression baissière domine (opportunité de vente potentielle).
Zone du niveau 50 – Des lectures autour du milieu (≈50) indiquent un équilibre entre acheteurs et vendeurs, tandis que des lectures extrêmes (au-dessus de 75 ou en dessous de 25) montrent une forte pression directionnelle.
Boost du facteur de tendance – L'indicateur adapte ses signaux en fonction de la confirmation de tendance par l'ADX ou la pente de l'EMA, réduisant les faux signaux lors des marchés latéraux.
Comment fonctionne l'indicateur
Le CPI calcule la pression en utilisant un modèle pondéré qui prend en compte :
Structure du chandelier : la taille du corps et la position de la clôture par rapport au plus haut/plus bas.
Momentum : mouvement du prix comparé au chandelier précédent.
Volume : la pondération par volume de tick garantit que les mouvements à fort volume ont plus d'importance.
Confirmation de tendance : soit la force de l'ADX soit la pente de l'EMA ajoute un facteur de boost pour aligner les signaux avec la tendance dominante.
Lissage : un filtre SMA défini par l'utilisateur assure des lignes lisses et stables sans perdre en réactivité.
Cette formule avancée signifie que le CPI ne réagit pas seulement au prix, mais comprend aussi pourquoi le prix bouge – offrant aux traders une compréhension plus profonde du comportement du marché.
Caractéristiques clés
Visualisation à double ligne – Comparez instantanément la pression d'achat et de vente avec des lignes codées par couleur (cyan pour les acheteurs, rouge pour les vendeurs).
Boost adaptatif de tendance – Intègre l'ADX ou l'EMA pour confirmer la direction de la tendance et réduire les faux signaux.
Calcul sensible au volume – Pondéré par le volume de tick pour mettre en évidence les mouvements soutenus par une réelle participation du marché.
Affichage lissé et propre – Filtre SMA intégré pour des lectures fluides sans distorsions lentes.
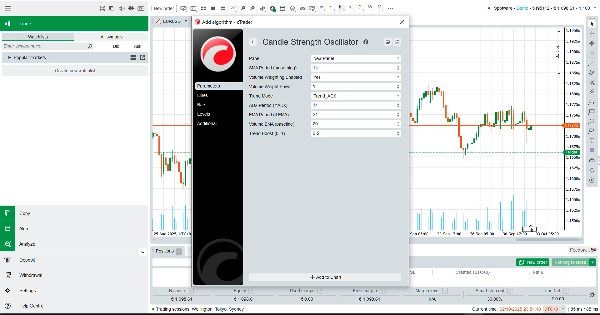
Entièrement personnalisable – Périodes, pondérations et intensité du boost ajustables pour correspondre à tout style de trading.
Pourquoi utiliser l'indice de pression des chandeliers ?
Le CPI est parfait pour les traders qui veulent aller au-delà de la simple action des prix et voir la véritable bataille entre acheteurs et vendeurs. Que vous soyez scalpeur, trader swing ou suiveur de tendance, cet indicateur gratuit vous donne la clarté nécessaire pour synchroniser les entrées, gérer le risque et rester aligné avec la véritable direction du marché.
Téléchargez l'indice de pression des chandeliers (CPI) dès aujourd'hui – et tradez en toute confiance en comprenant les forces cachées qui animent chaque chandelier.
Résumé
The indicator displays two smooth lines: Buy Pressure (cyan) and Sell Pressure (red). Crossovers between these lines signal shifts in market dominance, helping traders identify trend strength, potential reversals, and optimal entry or exit points. Readings near the midpoint indicate balance, while extremes suggest strong directional pressure.
CPI incorporates volume-weighted calculations and trend-based boosts to reduce false signals during sideways markets. It includes a smoothing filter for stable, responsive readings and offers customization of periods, weighting, and trend boost intensity.
This tool is applicable across various markets including Forex, commodities, stocks, and cryptocurrencies, supporting trading strategies such as scalping and breakout trading. It aims to provide traders with enhanced insight into market dynamics beyond simple price action.
Avis clients
5 | 0 % | |
4 | 100 % | |
3 | 0 % | |
2 | 0 % | |
1 | 0 % |