
Daily Open Color Zones
Indicateur
346 téléchargements
Version 1.0, Sep 2025
Windows, Mac
4.0
Avis : 1
Description
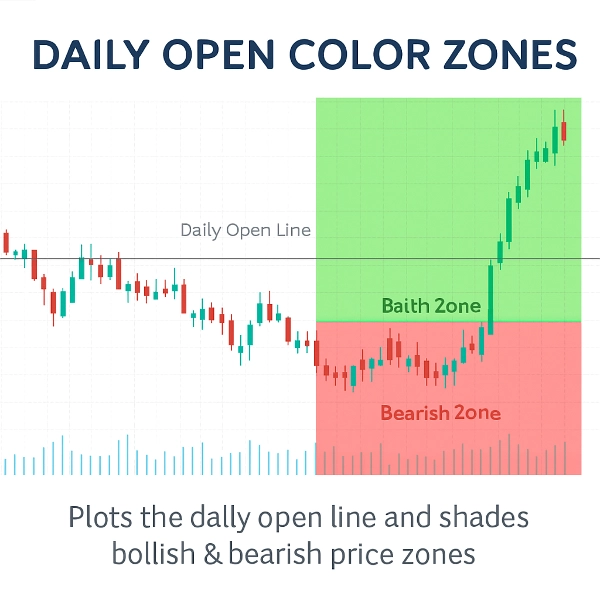
Cet indicateur trace la ligne d'ouverture quotidienne et ombrage les zones de prix haussières et baissières autour de celle-ci.
Il fournit une référence visuelle claire pour voir si le marché se négocie au-dessus ou en dessous de l'ouverture quotidienne, qui est un niveau couramment utilisé dans l'analyse intrajournalière.
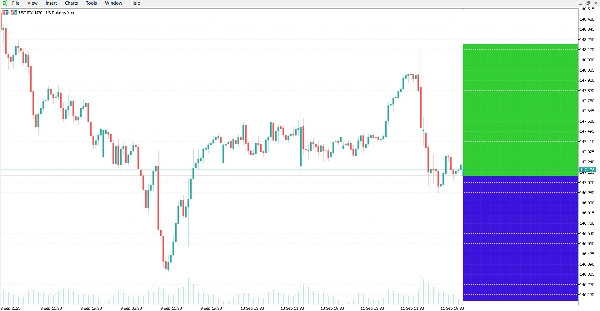
L'indicateur trace automatiquement une ligne horizontale au prix d'ouverture quotidienne et met en évidence les zones du graphique :
- Zone verte au-dessus de la ligne (zone haussière).
- Zone rouge en dessous de la ligne (zone baissière).
Caractéristiques :
- Ligne d'ouverture quotidienne automatique : tracé précis du prix d'ouverture quotidienne.
- Zones colorées : distinguez facilement les zones haussières et baissières avec des couleurs personnalisables.
- Mises à jour dynamiques : les zones s'ajustent automatiquement à chaque nouvelle bougie.
- Apparence personnalisable : le style de ligne, l'épaisseur et les couleurs des zones peuvent être modifiés.
- Léger et efficace : conçu pour une utilisation minimale du CPU.
- Fonctionne sur tous les symboles et toutes les périodes.
Conclusion :
L'indicateur offre une visualisation claire du graphique de l'ouverture quotidienne et des zones haussières/baissières associées. Il peut être appliqué à différents marchés et périodes pour l'analyse technique.
Résumé
Résumé IA
The Daily Open Color Zones indicator visually marks the daily open price on trading charts by automatically plotting a horizontal line at this level. It shades the price area above the daily open line in green to indicate bullish zones and the area below in red to indicate bearish zones. These color-coded zones update dynamically with each new candle, providing real-time visual cues about market direction relative to the daily open. The indicator supports all symbols and timeframes, making it applicable across various markets including Forex, cryptocurrencies, and commodities like gold (XAUUSD). Users can customize the line style, thickness, and zone colors to suit their preferences. Designed to be lightweight, it minimizes CPU usage while offering clear intraday reference points commonly used in technical analysis and scalping strategies.
Profil de l'indicateur
Avis clients
4.0
Avis : 1
5 | 0 % | |
4 | 100 % | |
3 | 0 % | |
2 | 0 % | |
1 | 0 % |
Avis clients
October 20, 2025
Clean and visual 🎨 - Daily Open Zones make trend bias crystal clear. Great tool for intraday planning and momentum entries!
Discussion
Questions fréquentes
Forex
Scalping
EURUSD
Crypto
Grid
XAUUSD
Les produits disponibles sur cTrader Store, notamment les bots de trading, les indicateurs et les plug-ins, sont fournis par des développeurs tiers et mis à disposition à titre informatif et à des fins d'accès technique uniquement. cTrader Store n'est pas un courtier et ne fournit aucun conseil en investissement, aucune recommandation personnelle ni aucune garantie quant aux performances futures.


Prix
Depuis le 13/09/2025
27
Ventes
5.4K
Installations gratuites