Mô tả
SC RSI Dots
Chỉ báo RSI tối giản sử dụng các chấm động để hiển thị động lượng rõ ràng và nhanh hơn.
SC RSI Dots là một cách diễn giải tối giản của RSI cổ điển (Chỉ số sức mạnh tương đối), được thiết kế để cung cấp cái nhìn rõ ràng và trực quan hơn về động lượng thị trường mà không làm rối biểu đồ với các đường không cần thiết.
Thay vì hiển thị đường RSI truyền thống, chỉ báo sử dụng các chấm động để biểu diễn các giá trị RSI theo thời gian.
Cách tiếp cận này tạo ra một bố cục biểu đồ sạch sẽ, hiện đại hơn và dễ đọc hơn, đặc biệt dành cho các nhà giao dịch sử dụng nhiều công cụ cùng lúc.
Các tính năng chính
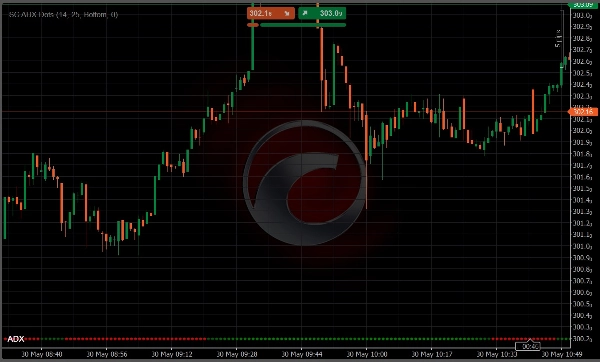
- RSI được hiển thị bằng các chấm thay vì đường
- Giao diện biểu đồ sạch sẽ và ít gây phân tâm hơn
- Hiển thị màu sắc động dựa trên vị trí RSI
- Màu sắc riêng biệt cho điều kiện Bán quá mức
- Màu sắc riêng biệt cho điều kiện Mua quá mức
- Cường độ màu sắc tăng dần khi RSI tiến gần đến các mức cực đoan
- Nhận diện trực quan tức thì các chuyển biến động lượng
- Nhận biết nhanh sức mạnh và điểm yếu của thị trường
- Lý tưởng cho scalping, giao dịch trong ngày và giao dịch tùy ý
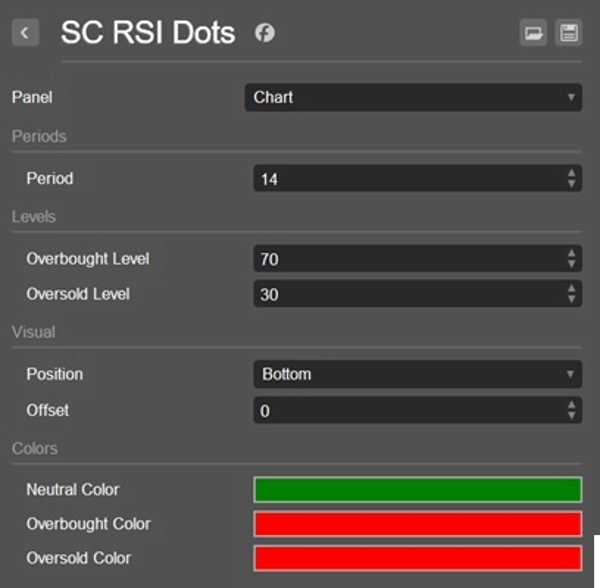
Cách hệ thống màu hoạt động
SC RSI Dots sử dụng một động cơ màu động để đơn giản hóa việc diễn giải RSI.
- Một màu sắc riêng biệt xác định điều kiện Bán quá mức.
- Một màu sắc riêng biệt xác định điều kiện Mua quá mức.
- Giữa hai vùng này, cường độ màu tăng dần khi RSI tiến gần đến một trong hai cực.
Cách tiếp cận trực quan này cho phép các nhà giao dịch nhanh chóng hiểu được nơi nào động lượng đang phát triển mà không cần phải liên tục theo dõi đường dao động truyền thống.
Kết quả là việc đọc các điều kiện RSI trở nên nhanh hơn và trực quan hơn ngay trên biểu đồ.
Tại sao nên dùng SC RSI Dots
Các chỉ báo RSI truyền thống thường yêu cầu nhà giao dịch liên tục theo dõi đường dao động và sự tương tác của nó với các mức mua quá mức và bán quá mức.
SC RSI Dots được tạo ra với một mục tiêu duy nhất:
giữ cho biểu đồ sạch sẽ về mặt hình ảnh trong khi vẫn cung cấp tất cả thông tin cần thiết về động lượng và điều kiện thị trường.
Việc hiển thị bằng các chấm thích ứng giúp dễ dàng nhận biết:
- Động lượng tăng của phe mua
- Động lượng tăng của phe bán
- Tiến gần đến điều kiện Mua quá mức
- Tiến gần đến điều kiện Bán quá mức
- Khả năng cạn kiệt động lượng
Tất cả mà không gây phân tâm bởi các đường bổ sung trên màn hình.
Phù hợp cho
- Các nhà giao dịch ưa thích biểu đồ sạch sẽ
- Các nhà giao dịch động lượng
- Các nhà giao dịch hành động giá
- Scalper và nhà giao dịch trong ngày
- Các thiết lập giao dịch đa chỉ báo
- Phân tích thị trường nhanh
Lưu ý quan trọng
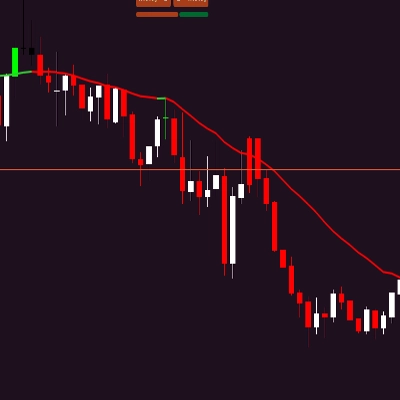
SC RSI Dots được thiết kế để sử dụng trực tiếp trên biểu đồ giá chính.
Khác với các chỉ báo RSI truyền thống, khái niệm hình ảnh của nó được xây dựng xoay quanh việc tích hợp thông tin động lượng vào phân tích hành động giá. Vì lý do này, việc sử dụng chỉ báo trong một bảng riêng biệt không được khuyến nghị và không mang lại trải nghiệm người dùng như mong muốn.
Đơn giản. Sạch sẽ. Trực quan.
Tóm tắt
Key features include:
- RSI values represented by dots with dynamic colors reflecting momentum strength.
- Distinct colors for oversold and overbought conditions.
- Progressive color intensity indicating proximity to extreme RSI levels.
- Instant visual cues for momentum shifts, market strength, and weakness.
The indicator is suitable for scalping, intraday, momentum, and price action traders who prefer clean charts and use multiple tools simultaneously. It supports visualization of reversal signals, trend strength, and level touches or breaks based on RSI behavior. SC RSI Dots is intended for use on the main price chart rather than a separate panel, enhancing direct correlation between momentum and price movements.
Đánh giá của khách hàng
5 | 100 % | |
4 | 0 % | |
3 | 0 % | |
2 | 0 % | |
1 | 0 % |