
Mô tả
SC MACD Dots
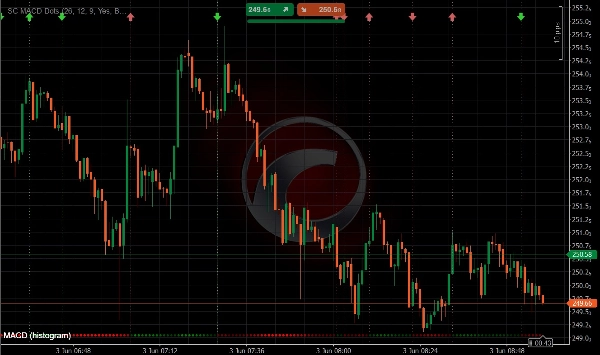
SC MACD Dots là phiên bản tối giản của chỉ báo MACD cổ điển, được thiết kế để cung cấp cái nhìn rõ ràng và trực quan hơn về động lượng mà không làm rối biểu đồ với các thanh biểu đồ truyền thống và nhiều đường.
Thay vì hiển thị biểu đồ MACD tiêu chuẩn, chỉ báo sử dụng các chấm động để đại diện cho các giá trị biểu đồ theo thời gian. Cách tiếp cận này tạo ra một bố cục hiện đại và hiệu quả về mặt thị giác, cho phép nhà giao dịch nhanh chóng nhận biết sự thay đổi động lượng, tăng tốc xu hướng và khả năng đảo chiều.
Các chấm thay đổi cả màu sắc và cường độ theo sức mạnh của biểu đồ, giúp dễ dàng nhận ra động lượng tăng hoặc giảm chỉ trong nháy mắt.
Ngoài ra, SC MACD Dots tự động làm nổi bật các điểm cắt đường tín hiệu MACD, cho phép nhà giao dịch nhanh chóng nhận biết các thay đổi xu hướng và sự chuyển động của động lượng.
Tính Năng Chính
• Biểu đồ hiển thị bằng các chấm động thay vì các thanh truyền thống
• Giao diện biểu đồ sạch sẽ và ít gây phân tâm hơn
• Màu sắc và cường độ của chấm thay đổi động theo sức mạnh biểu đồ
• Nhận diện trực quan tức thì về động lượng tăng và giảm
• Phát hiện tự động các sự kiện cắt MACD
• Màu sắc khác nhau cho các điểm cắt lên và xuống
• Các điểm cắt vùng dương và vùng âm sử dụng phong cách thị giác khác nhau
• Giúp diễn giải nhanh hơn các thay đổi động lượng và đảo chiều xu hướng
• Lý tưởng cho scalping, giao dịch trong ngày, giao dịch swing và giao dịch tùy ý
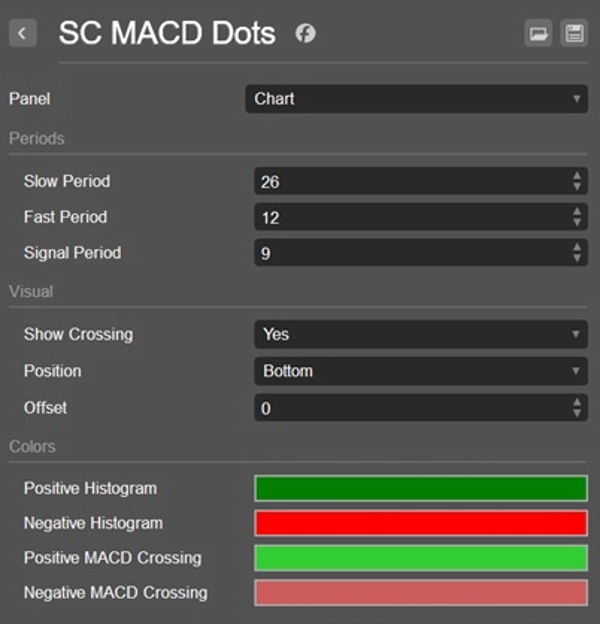
Hiển Thị Các Điểm Cắt
SC MACD Dots làm nổi bật mọi sự kiện cắt MACD:
• Các điểm cắt lên (tăng giá) được hiển thị bằng màu sắc tăng giá riêng biệt
• Các điểm cắt xuống (giảm giá) được hiển thị bằng màu sắc giảm giá riêng biệt
• Các điểm cắt xảy ra trên đường số 0 (vùng MACD dương) sử dụng bảng màu khác với các điểm cắt dưới đường số 0 (vùng MACD âm)
• Điều này cho phép nhà giao dịch nhanh chóng phân biệt giữa các tín hiệu động lượng mạnh và yếu
Tại Sao Nên Dùng SC MACD Dots
Các chỉ báo MACD truyền thống thường yêu cầu nhà giao dịch theo dõi nhiều đường và thanh biểu đồ cùng lúc, điều này có thể làm biểu đồ trở nên chật chội và khó đọc.
SC MACD Dots được tạo ra với một mục tiêu duy nhất:
đơn giản hóa phân tích MACD trong khi vẫn giữ nguyên tất cả thông tin động lượng cần thiết.
Việc hiển thị chấm thích ứng cho phép nhà giao dịch nhanh chóng đánh giá sức mạnh biểu đồ, tăng tốc động lượng, giảm tốc động lượng và các tín hiệu cắt mà không bị phân tâm bởi các yếu tố thị giác không cần thiết.
Bằng cách kết hợp các chấm biểu đồ động với hiển thị thông minh các điểm cắt, nhà giao dịch có thể nhận biết cơ hội nhanh hơn và duy trì không gian làm việc giao dịch sạch sẽ hơn.
Phù Hợp Với
• Nhà giao dịch thích biểu đồ sạch
• Nhà giao dịch động lượng
• Scalper và nhà giao dịch trong ngày
• Nhà giao dịch swing
• Các thiết lập giao dịch đa chỉ báo
• Phân tích thị trường nhanh
• Nhà giao dịch dựa vào tín hiệu cắt MACD
Lưu Ý Quan Trọng
SC MACD Dots được thiết kế để sử dụng trực tiếp trên biểu đồ giá chính.
Không giống như các chỉ báo MACD truyền thống, khái niệm thị giác của nó được xây dựng xoay quanh việc tích hợp thông tin động lượng vào phân tích hành động giá. Vì lý do này, việc sử dụng chỉ báo trong một bảng riêng biệt không được khuyến nghị và không mang lại trải nghiệm người dùng như mong muốn.
Đơn giản. Sạch sẽ. Mạnh mẽ.
Tóm tắt
Đánh giá của khách hàng
5 | 100 % | |
4 | 0 % | |
3 | 0 % | |
2 | 0 % | |
1 | 0 % |


