Açıklama
SC Piyasa Yapısı
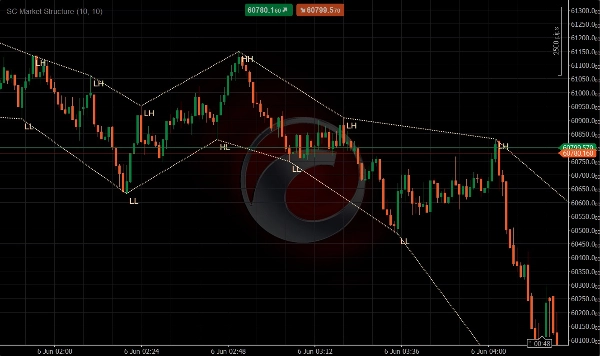
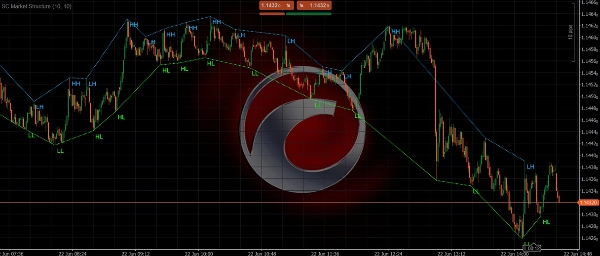
SC Piyasa Yapısı, en önemli salınım yükseklerini ve salınım düşüklerini otomatik olarak tanımlayıp doğrudan grafik üzerinde gösteren görsel bir piyasa yapısı göstergesidir.
Gösterge, fiyat hareketlerini sürekli analiz eder ve önemli yüksekler ile düşükleri dinamik yapı çizgileriyle bağlayarak piyasa yapısının evrimini haritalar. Bu, yatırımcıların piyasa salınımlarını manuel olarak işaretlemeden trend yönünü, trend devamını ve potansiyel dönüş noktalarını anında tanımasını sağlar.
Ayrıca, SC Piyasa Yapısı her yeni yapısal noktayı standart piyasa yapısı tanımları kullanarak otomatik olarak sınıflandırır:
- HH (Daha Yüksek Yüksek)
- HL (Daha Yüksek Düşük)
- LH (Daha Düşük Yüksek)
- LL (Daha Düşük Düşük)
Otomatik salınım tespiti ile gerçek zamanlı piyasa yapısı etiketlemesini birleştirerek, yatırımcılar piyasanın trendde mi, konsolide mi yoksa potansiyel bir trend dönüşü mü gösterdiğini hızlıca anlayabilirler.
Ana Özellikler
• Önemli salınım yüksekleri ve düşüklerinin otomatik tespiti
• Piyasa dönüm noktalarını bağlayan dinamik yapı çizgileri
• Daha Yüksek Yükseklerin (HH) otomatik tanımlanması
• Daha Yüksek Düşüklerin (HL) otomatik tanımlanması
• Daha Düşük Yükseklerin (LH) otomatik tanımlanması
• Daha Düşük Düşüklerin (LL) otomatik tanımlanması
• Boğa ve ayı piyasa yapısının net görselleştirilmesi
• Trend devamı ve dönüş desenlerinin anında tanınması
• Tüm piyasalarda ve zaman dilimlerinde çalışır
• Temiz ve sezgisel grafik sunumu
Piyasa Yapısı Görselleştirmesi
SC Piyasa Yapısı, fiyat salınımlarını sürekli değerlendirir ve her yeni onaylanmış yapısal noktayı etiketler.
Boğa Yapısı
Fiyat şu şekillerde oluştuğunda boğa piyasa yapısı tanımlanır:
• Daha Yüksek Yüksekler (HH)
• Daha Yüksek Düşükler (HL)
Bu sıra, alıcıların kontrolü elinde tuttuğunu ve yükseliş trendinin devam ettiğini gösterir.
Ayı Yapısı
Fiyat şu şekillerde oluştuğunda ayı piyasa yapısı tanımlanır:
• Daha Düşük Yüksekler (LH)
• Daha Düşük Düşükler (LL)
Bu sıra, satıcıların kontrolü elinde tuttuğunu ve düşüş trendinin devam ettiğini gösterir.
Gösterge, bu yapısal noktaları dinamik trend çizgileri kullanarak görsel olarak bağlar ve yatırımcıların fiyat yapısının evrimini gerçek zamanlı takip etmesini sağlar.
Neden SC Piyasa Yapısı Kullanılmalı
Piyasa yapısını anlamak, fiyat hareketi ticaretinin en önemli yönlerinden biridir.
Birçok yatırımcı salınım yükseklerini, salınım düşüklerini ve trend yapısını manuel olarak çizer; bu zaman alıcı ve öznel olabilir.
SC Piyasa Yapısı, yapısal dönüm noktalarını nesnel olarak tanımlayarak ve profesyonel piyasa yapısı prensiplerine göre etiketleyerek bu süreci otomatikleştirir.
Bu sayede yatırımcılar:
• Trend yönünü daha hızlı okuyabilir
• Potansiyel dönüşleri daha erken tespit edebilir
• Trend devamı kurulumlarını onaylayabilir
• Giriş ve çıkış zamanlamasını iyileştirebilir
• Daha temiz ve düzenli bir grafik tutabilir
Kullanım İçin İdeal
• Fiyat Hareketi yatırımcıları
• Scalperlar
• Günlük yatırımcılar
• Salınım yatırımcıları
• Trend takip eden yatırımcılar
• Piyasa Yapısı yatırımcıları
• Akıllı Para Konsepti (SMC) yatırımcıları
• Nesnel yapı analizi arayan yatırımcılar
Önemli Not
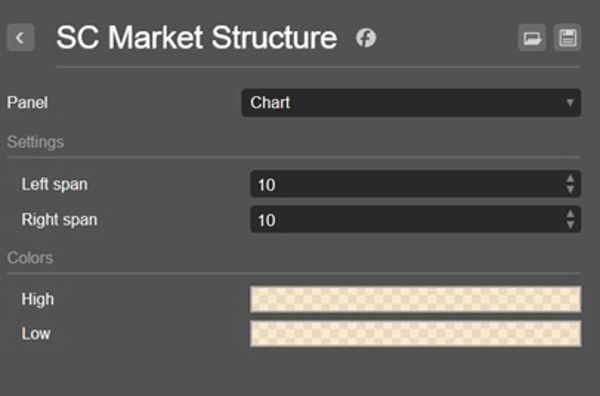
SC Piyasa Yapısı, onaylanmış salınım yüksekleri ve düşüklerine dayanarak piyasa yapısını tanımlar. Etiketler ve yapı çizgileri, yalnızca seçilen hesaplama ayarlarıyla bir pivot doğrulandıktan sonra oluşturulur.
Duyarlılık ayarlarını değiştirmek, yeni yapı noktalarının ne sıklıkla tanımlanıp gösterileceğini etkiler.
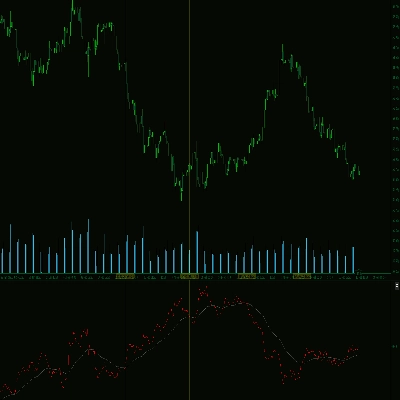
Geleneksel MACD göstergelerinin aksine, görsel konsepti momentum bilgisini fiyat hareketi analizine entegre etmeye dayanır. Bu nedenle, göstergenin ayrı bir panelde kullanılması önerilmez ve amaçlanan kullanıcı deneyimini sağlamaz.
Trendi okuyun. Yapıyı takip edin. Güvenle işlem yapın.
Özet
By continuously analyzing price action, SC Market Structure helps traders quickly determine trend direction, recognize trend continuation, and spot potential reversal points without manual chart annotations. It supports all markets and timeframes, providing a clean and intuitive chart presentation.
This tool is suited for price action traders, scalpers, day traders, swing traders, trend followers, and those using Smart Money Concepts or seeking objective market structure analysis. Sensitivity settings allow customization of pivot detection frequency. The indicator integrates momentum information into price action analysis and is designed for direct chart overlay rather than separate panels.
Müşteri değerlendirmeleri
5 | 100 % | |
4 | 0 % | |
3 | 0 % | |
2 | 0 % | |
1 | 0 % |