Penerangan
SC ADX Dots
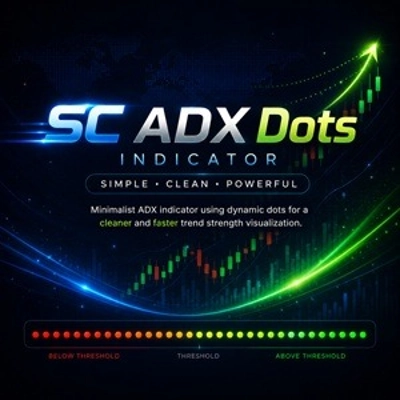
SC ADX Dots adalah versi minimalis bagi penunjuk ADX klasik, direka untuk memberikan pandangan yang lebih bersih dan intuitif mengenai kekuatan tren tanpa memenuhi carta dengan garis yang tidak perlu.
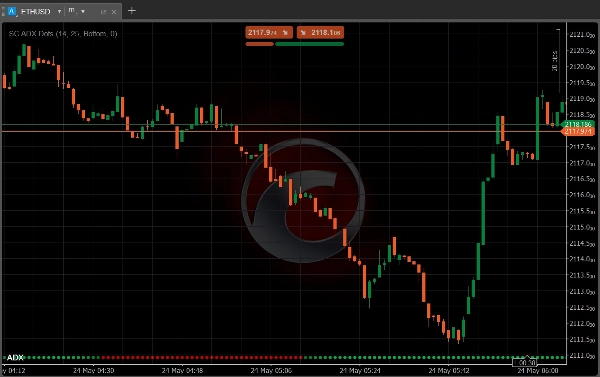
Daripada memaparkan garis ADX tradisional, penunjuk ini menggunakan titik dinamik untuk mewakili nilai ADX dari masa ke masa.
Pendekatan ini menghasilkan susun atur carta yang lebih bersih dan moden yang lebih mudah dibaca, terutamanya bagi pedagang yang menggunakan pelbagai alat secara serentak.
Ciri-ciri Utama
- ADX dipaparkan menggunakan titik dan bukannya garis
- Penampilan carta yang lebih bersih dan kurang mengganggu
- Dua mod warna berbeza:
-
- satu warna apabila ADX di bawah ambang
- satu warna apabila ADX di atas ambang
- Intensiti warna berubah secara dinamik mengikut kekuatan ADX
- Pembacaan visual pantas mengenai momentum tren
- Sesuai untuk scalping, perdagangan intrahari, dan perdagangan budi bicara
Mengapa Menggunakan SC ADX Dots
Penunjuk ADX tradisional boleh menyebabkan carta kelihatan sesak dan sukar dibaca, terutamanya apabila digabungkan dengan penunjuk lain atau alat tindakan harga.
SC ADX Dots dicipta dengan satu tujuan:
untuk memastikan carta kelihatan bersih secara visual sambil masih menyediakan semua maklumat penting mengenai kekuatan tren.
Visualisasi titik adaptif membolehkan pedagang mengenal pasti dengan segera sama ada momentum pasaran meningkat atau menurun, tanpa gangguan garis tambahan di seluruh skrin.
Sesuai Untuk
- Pedagang yang mengutamakan carta yang bersih
- Pedagang tindakan harga
- Scalper dan pedagang harian
- Susunan perdagangan pelbagai penunjuk
- Analisis pasaran yang pantas
Nota Penting
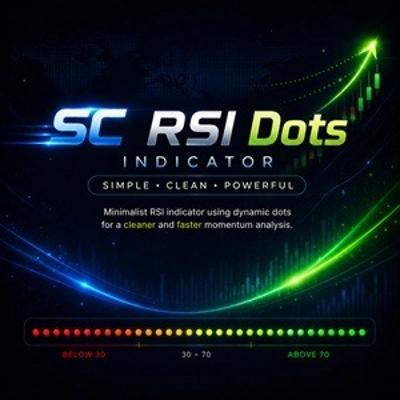
SC RSI Dots direka untuk digunakan terus pada carta harga utama.
Berbeza dengan penunjuk RSI tradisional, konsep visualnya dibina sekitar mengintegrasikan maklumat momentum ke dalam analisis tindakan harga. Oleh itu, penggunaan penunjuk ini dalam panel berasingan tidak digalakkan dan tidak memberikan pengalaman pengguna yang dimaksudkan.
Ringkas. Bersih. Berkesan.
Ringkasan
Perbincangan
Ulasan pelanggan
5 | 100 % | |
4 | 0 % | |
3 | 0 % | |
2 | 0 % | |
1 | 0 % |