
الوصف
مجموعة أدوات الدعم والمقاومة هي مؤشر شامل لتحليل هيكل السوق مصمم لمساعدة المتداولين على تحديد مناطق الدعم والمقاومة ذات الاحتمالية العالية على الرسوم البيانية. من خلال دمج عدة خوارزميات متقدمة لاكتشاف نقاط الارتكاز مع مناطق تقلب تكيفية، ومرشحات تدفق الأموال المؤسسية، وتحليل السيولة، تحول هذه المجموعة أدوات الدعم والمقاومة التقليدية إلى أداة استراتيجية مدفوعة بالبيانات.
الاكتشاف
تتضمن هذه المجموعة أربع منهجيات اكتشاف متقدمة مصممة لتناسب أنماط تداول مختلفة وبيئات السوق:
- نقاط الارتكاز: النهج الكلاسيكي لاكتشاف الدعم والمقاومة باستخدام قوى نظر خلفية قابلة للتكوين لليسار واليمين لاكتشاف القمم والقيعان المحلية.
- دونشيان: خوارزمية حالة آلة عالية الأداء تكتشف هياكل التأرجح المتناوبة. بدلاً من استخدام تأخير ثابت، تؤكد القمم والقيعان عندما يغير السوق حالة الاتجاه.
- CSID: طريقة اكتشاف مدفوعة بالزخم تحدد نقاط التحول الهيكلية بناءً على شموع متتالية صاعدة أو هابطة، مبرزة مناطق بدء الاتجاه القوي.
- زيجزاج: خوارزمية تعتمد على التقلبات تقوم بتصفية تقلبات السعر الصغيرة من خلال طلب انحراف نسبي أدنى قبل تحديد التأرجح.
المنطقة / المستوى
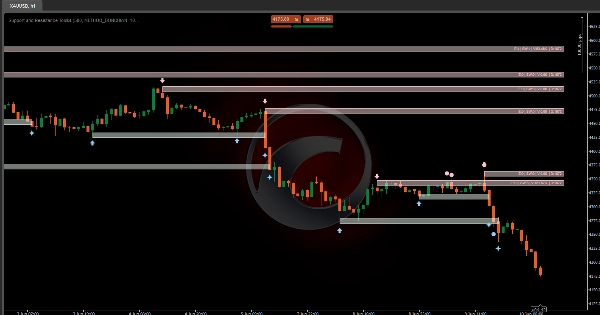
على عكس المؤشرات التقليدية التي ترسم خطوطًا ثابتة ببساطة، يتعامل هذا الأداة مع مستويات الدعم والمقاومة كمناطق سعرية ديناميكية بناءً على الميزات التالية:
- عمق المنطقة (مضاعف ATR): يحدد سمك كل منطقة بناءً على متوسط النطاق الحقيقي. هذا يسمح للمناطق بالتوسع تلقائيًا مع تقلبات السوق.
- مخزن الاختراق (مضاعف ATR): مخزن أمان فريد يمد المنطقة إلى ما بعد جانب الاختراق. يجب أن يتحرك السعر خارج هذه الطبقة الإضافية من التقلبات قبل أن يؤكد المؤشر الاختراق، مما يقلل من الإشارات الخاطئة والتلاعبات.
الترشيح والرؤية:
- دمج المناطق المتداخلة: يجمع المناطق المتقاطعة في "منطقة فائقة" أكبر تمثل نطاق التفاعل التاريخي الكامل.
- إخفاء الأقدم أولاً: يعطي الأولوية لهياكل السوق الحديثة عن طريق إخفاء المناطق الأقدم عند حدوث التداخل.
- إخفاء الأحدث أولاً: يحافظ على الهياكل التاريخية القائمة من خلال تجاهل المناطق الجديدة الأصغر التي تظهر ضمن النطاقات القائمة.
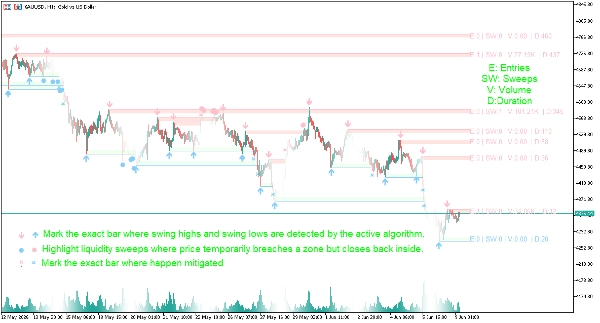
ترشيح المستوى ( E:الدخول | S:القوة | SW:المسح | V:الحجم | D:المدة )
- دخول السعر (E): يتطلب إعادة اختبار المستوى عددًا محددًا من المرات قبل ظهوره على الرسم البياني.
- المسح (SW): يكتشف فخاخ السيولة حيث ينتهك السعر المستوى لفترة وجيزة بواسطة فتيل لكنه يغلق داخل المنطقة مرة أخرى.
- حجم التداول (V): يتتبع إجمالي حجم التداول الذي يحدث أثناء تفاعل السعر مع المنطقة، مبرزًا المشاركة المؤسسية.
- المدة (D): يتطلب بقاء المناطق لعدد أدنى من الأعمدة قبل اعتبارها مستويات هيكلية صالحة.
الإشارات المرئية
- ⬆/⬇ الأسهم: تحدد العمود الدقيق حيث يتم اكتشاف قمم وقيعان التأرجح بواسطة الخوارزمية النشطة.
- ● النقاط الكبيرة: تبرز عمليات مسح السيولة حيث يخترق السعر المنطقة مؤقتًا لكنه يغلق داخلها مرة أخرى.
- ✖ الصليب: تحدد العمود الدقيق حيث يتم ترحيل قمم وقيعان التأرجح.
- تسميات الملخص: يتميز كل منطقة عرض بتسمية بيانات مختصرة تشمل المعلمات E (الدخول)، S (القوة)، SW (المسح)، V (الحجم)، وD (المدة)، مما يسمح للمستخدمين بتقييم جودة الهيكل بسرعة.
لوحة التحكم
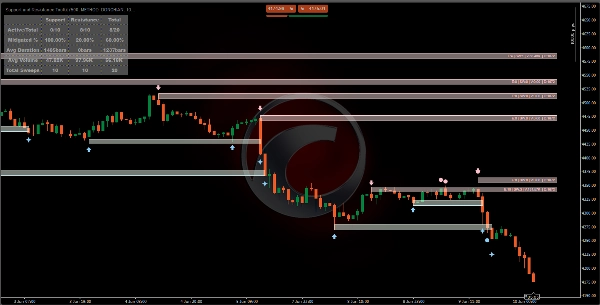
- النشط / الإجمالي: يعرض عدد الهياكل النشطة حاليًا مقارنة بالإجمالي المكتشف تاريخيًا.
- نسبة التخفيف: يقيس مدى تكرار كسر أو تخفيف المستويات، مما يوفر نظرة على موثوقية هيكل السوق.
- متوسط المدة: متوسط عدد الأعمدة التي تبقى فيها منطقة الدعم أو المقاومة قبل أن تُكسر.
- متوسط الحجم: يشير إلى متوسط المشاركة المؤسسية داخل المناطق قبل حدوث الاختراق.
- إجمالي المسح: يتتبع سلوك صيد السيولة عبر السوق.
إعدادات المؤشر
إعدادات الاكتشاف
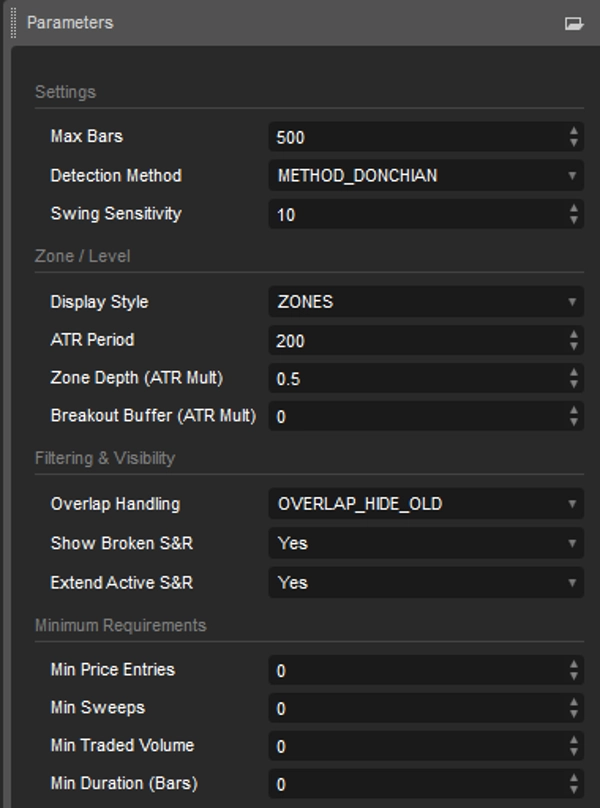
- طريقة الاكتشاف: اختر بين منطق اكتشاف التأرجح لنقاط الارتكاز، دونشيان، CSID، أو زيجزاج.
- حساسية التأرجح: يضبط الانحراف المطلوب أو طول النظر الخلفي اللازم لتأكيد قمم وقيعان التأرجح.
تكوين المنطقة والمستوى
- نمط العرض: التبديل بين خطوط الدعم والمقاومة الأفقية الدقيقة أو المناطق القائمة على ATR.
- فترة ATR: يحدد فترة التقلب المستخدمة لحساب المناطق.
- عمق المنطقة (مضاعف ATR): يضبط سمك مناطق الدعم والمقاومة.
- مخزن الاختراق (مضاعف ATR): يضيف مخزن تقلب لتصفية الاختراقات الخاطئة.
رؤية الرسم البياني والتحكم في الهيكل
- معالجة التداخل: اختر كيفية التعامل مع المناطق المتداخلة (دمج، إخفاء الأقدم، أو إخفاء الأحدث).
- الحد الأقصى للنشط (غير المخفف): يحدد عدد مناطق الدعم والمقاومة النشطة المعروضة على الرسم البياني.
- عرض الدعم والمقاومة المكسورة: تبديل ما إذا كانت المستويات المكسورة تظل مرئية للتحليل التاريخي.
- تمديد الدعم والمقاومة النشطة: يعرض المستويات النشطة في أعمدة السعر المستقبلية.
المتطلبات الهيكلية الدنيا
- الحد الأدنى لدخول السعر: يحدد عدد إعادة الاختبارات المطلوبة قبل أن يصبح المستوى مرئيًا.
- الحد الأدنى للمسح: يتطلب عددًا معينًا من مسحات السيولة قبل عرض المنطقة.
- الحد الأدنى لحجم التداول: يضمن أن تلبي المناطق حدًا أدنى من المشاركة المؤسسية.
- الحد الأدنى للمدة (الأعمدة): يتطلب وجود المستويات لعدد محدد من الأعمدة قبل ظهورها.
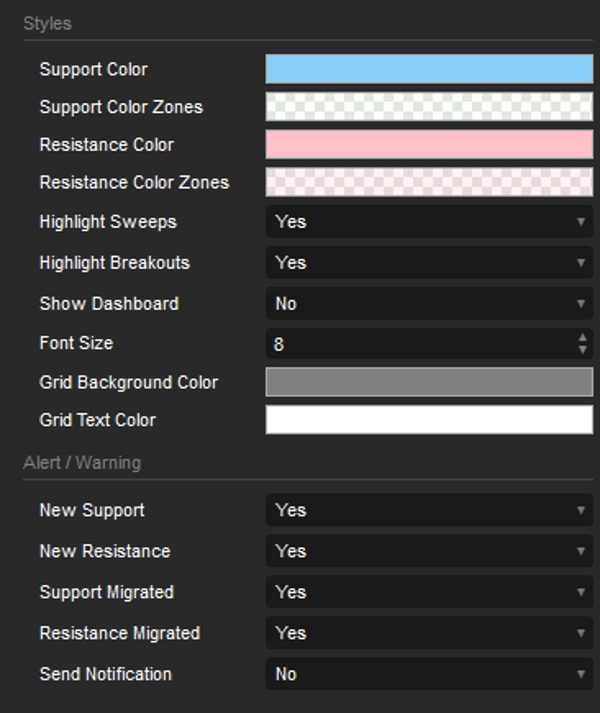
الأنماط والتنبيه
- الأنماط: ضبط تكوين لون الكائن. إخفاء/عرض لوحة التحكم.
- التنبيه: تشغيل/إيقاف التنبيهات عند اكتشاف دعم أو مقاومة جديدة أو عند ترحيل دعم أو مقاومة.
الملخص
Unlike traditional fixed lines, this tool defines support and resistance as dynamic price zones, with thickness and breakout buffers scaled by Average True Range (ATR) to adapt to market volatility. It features zone merging and selective visibility options to manage overlapping zones, prioritizing recent or historical structures as needed.
The indicator applies multiple filters based on price re-tests, liquidity sweeps, traded volume, and zone duration to validate structural levels. Visual signals include arrows marking swing points, dots highlighting liquidity sweeps, crosses for migrated swings, and summary labels displaying entries, strength, sweeps, volume, and duration metrics.
A dashboard provides real-time statistics on active versus total structures, mitigation percentages, average zone duration, volume, and liquidity sweep counts. Users can customize detection methods, sensitivity, zone display styles, ATR parameters, overlap handling, and structural requirements. Alerts can be enabled for new or migrated support and resistance levels.
This toolkit supports detailed market structure analysis with data-driven, volatility-adjusted zones to assist traders in identifying key price areas.


![شعار "[Stellar Strategies] Inside Bar with Signals"](https://cdn.ctrader.com/image/webp/1d9e8bfa-3b2c-4440-bb37-5856902008a7_30683)


