
Açıklama
💡 Doğrusal Regresyon Kanalları ve ZigZag Noktaları 💡
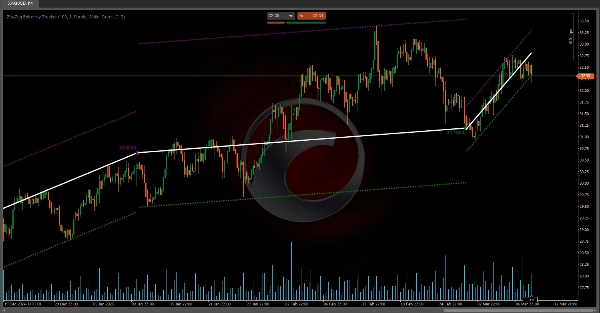
• Doğrusal regresyon kanalları, fiyat beklenen sınırların (bantların) ötesine her hareket ettiğinde yeniden hesaplanır ve sıfırlanır, böylece ölçüm piyasanın gerçek trendiyle güncel kalır.
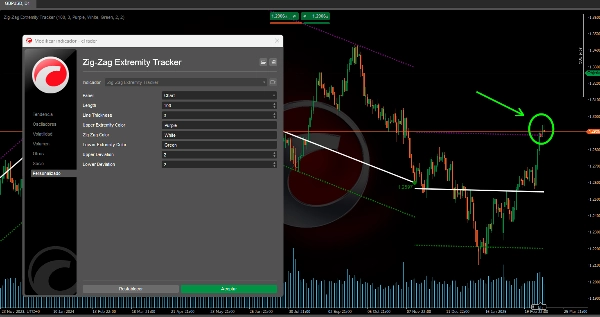
• İşaretlenen noktalar (dairalar), ZigZag çizimi için temel oluşturan ve kanalların nereden hesaplandığını belirleyen uç noktaları (yüksekler ve düşükler) temsil eder.
• Bu dinamik yaklaşım, potansiyel trend değişikliklerinin yanı sıra fiyatın ortalamaya dönebileceği aşırı genişleme veya aşırı satış alanlarının daha iyi görselleştirilmesini sağlar.
❓ Kanallar ZigZag ve uç noktalarla nasıl ilişkilidir? ❓
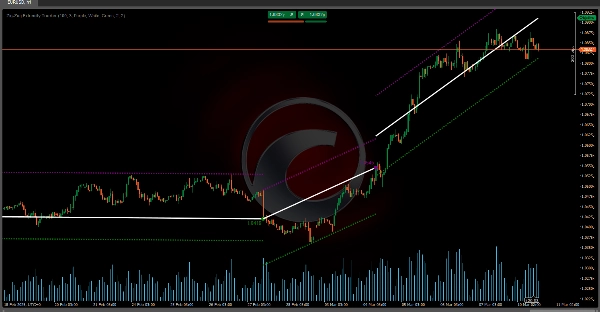
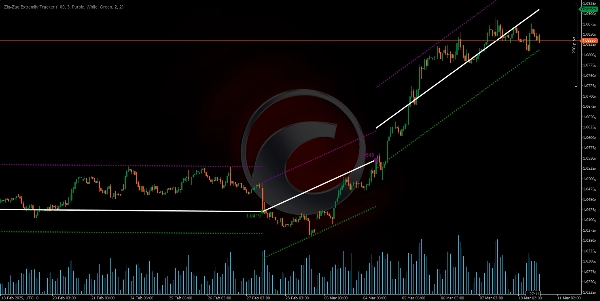
• Yeni bir uç nokta (yüksek veya düşük) tespit edildiğinde, gösterge sadece o noktayı öncekiyle bağlayan ZigZag çizgisi ve bir daire çizmekle kalmaz, aynı zamanda o son uç noktadan çizilen potansiyel doğrusal regresyon kanalını da yeniden ayarlar.
• Takip eden barlarda fiyat bantlar içinde kaldığı sürece kanal aktif kalır ve mevcut bara kadar uzatılır.
• Fiyat herhangi bir anda bu bantları kırarsa, gösterge kanalın geçersiz olduğunu “varsayar” ve kırılmanın gerçekleştiği bardan yeni bir kanal başlatır.
Ctrader Store göstergeleri:
Dinamik Piyasa Yapısı
Dönüş Noktalarının Analizi
Fibonacci Doğrusal
Regresyon Çok Zaman Dilimli
Çok Katmanlı Mum Eğilimi
Takipçisi
Otomatik Destek ve
Direnç Trend Çizgileri
Tüm Destek ve
Direnç Seviyeleri
Dinamik Piyasa Yapısı Dönüş Noktalarının Analizi
Fibonacci Doğrusal Regresyon Çok Zaman Dilimli
Çok Katmanlı Mum Eğilimi Takipçisi
Otomatik Destek ve Direnç Trend Çizgileri
Özet
Müşteri değerlendirmeleri
5 | 50 % | |
4 | 50 % | |
3 | 0 % | |
2 | 0 % | |
1 | 0 % |


