Descrição
SC RSI Dots
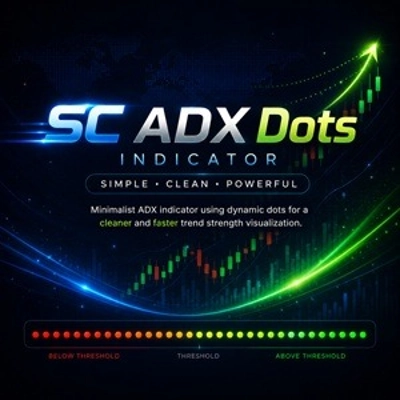
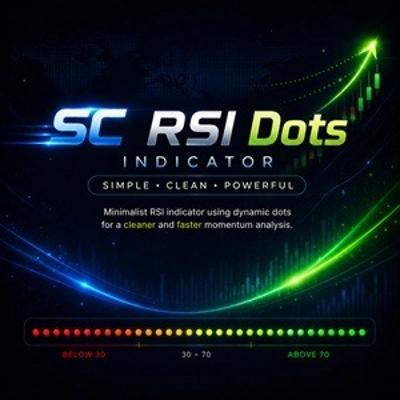
Indicador RSI minimalista usando pontos dinâmicos para uma visualização de momentum mais limpa e rápida.
SC RSI Dots é uma interpretação minimalista do clássico RSI (Índice de Força Relativa), projetada para fornecer uma visão mais limpa e intuitiva do momentum do mercado sem poluir o gráfico com linhas desnecessárias.
Em vez de exibir a linha tradicional do RSI, o indicador usa pontos dinâmicos para representar os valores do RSI ao longo do tempo.
Essa abordagem cria um layout de gráfico mais limpo e moderno, que é mais fácil de ler, especialmente para traders que usam várias ferramentas simultaneamente.
Principais Características
- RSI exibido usando pontos em vez de linhas
- Aparência do gráfico mais limpa e menos distrativa
- Visualização dinâmica de cores baseada na posição do RSI
- Cor dedicada para condições de sobrevenda
- Cor dedicada para condições de sobrecompra
- Intensidade de cor progressiva conforme o RSI se aproxima de níveis extremos
- Identificação visual instantânea de mudanças de momentum
- Reconhecimento rápido da força e fraqueza do mercado
- Ideal para scalping, trading intradiário e trading discricionário
Como o Sistema de Cores Funciona
SC RSI Dots usa um motor de cores dinâmico para simplificar a interpretação do RSI.
- Uma cor dedicada identifica condições de sobrevenda.
- Uma cor dedicada identifica condições de sobrecompra.
- Entre essas duas zonas, a intensidade da cor aumenta gradualmente conforme o RSI se aproxima de qualquer extremo.
Essa abordagem visual permite que os traders entendam instantaneamente onde o momentum está se desenvolvendo sem precisar monitorar constantemente uma linha tradicional do oscilador.
O resultado é uma leitura mais rápida e intuitiva das condições do RSI diretamente no gráfico.
Por Que Usar SC RSI Dots
Indicadores tradicionais de RSI frequentemente exigem que os traders monitorem continuamente a linha do oscilador e sua interação com os níveis de sobrecompra e sobrevenda.
SC RSI Dots foi criado com um objetivo em mente:
manter o gráfico visualmente limpo enquanto ainda fornece todas as informações essenciais sobre momentum e condições de mercado.
A visualização adaptativa por pontos facilita o reconhecimento de:
- Momentum de alta crescente
- Momentum de baixa crescente
- Aproximação de condições de sobrecompra
- Aproximação de condições de sobrevenda
- Potencial exaustão do momentum
Tudo isso sem a distração de linhas adicionais na tela.
Perfeito Para
- Traders que preferem gráficos limpos
- Traders de momentum
- Traders de price action
- Scalpers e traders diários
- Configurações de trading com múltiplos indicadores
- Análise rápida de mercado
Nota Importante
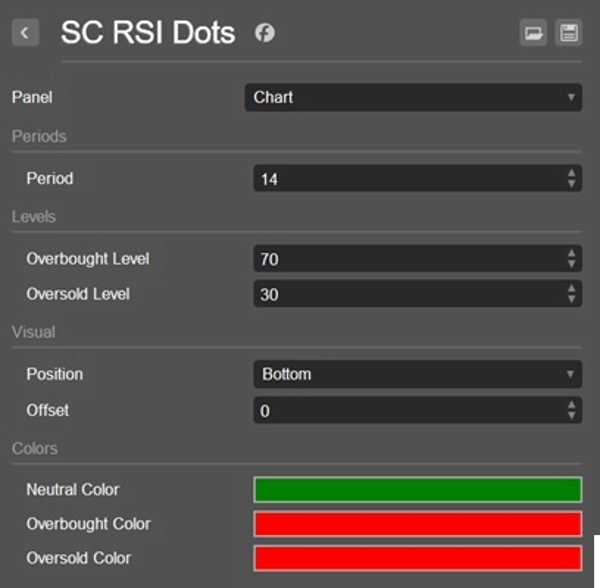
SC RSI Dots foi projetado para ser usado diretamente no gráfico principal de preços.
Ao contrário dos indicadores tradicionais de RSI, seu conceito visual é construído em torno da integração das informações de momentum na análise do price action. Por essa razão, usar o indicador em um painel separado não é recomendado e não proporciona a experiência de usuário pretendida.
Simples. Limpo. Intuitivo.
Resumo
Key features include:
- RSI values represented by dots with dynamic colors reflecting momentum strength.
- Distinct colors for oversold and overbought conditions.
- Progressive color intensity indicating proximity to extreme RSI levels.
- Instant visual cues for momentum shifts, market strength, and weakness.
The indicator is suitable for scalping, intraday, momentum, and price action traders who prefer clean charts and use multiple tools simultaneously. It supports visualization of reversal signals, trend strength, and level touches or breaks based on RSI behavior. SC RSI Dots is intended for use on the main price chart rather than a separate panel, enhancing direct correlation between momentum and price movements.
Conversa
Avaliações de clientes
5 | 100 % | |
4 | 0 % | |
3 | 0 % | |
2 | 0 % | |
1 | 0 % |