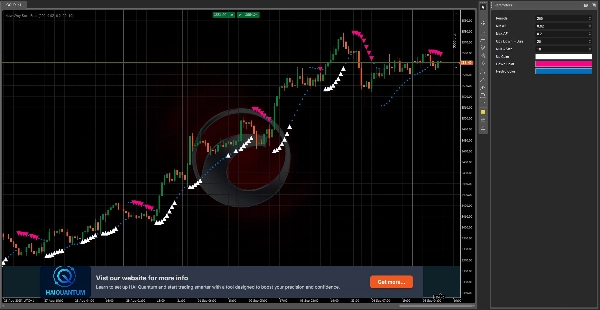
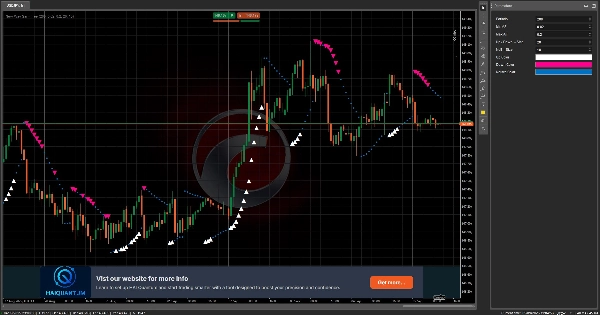
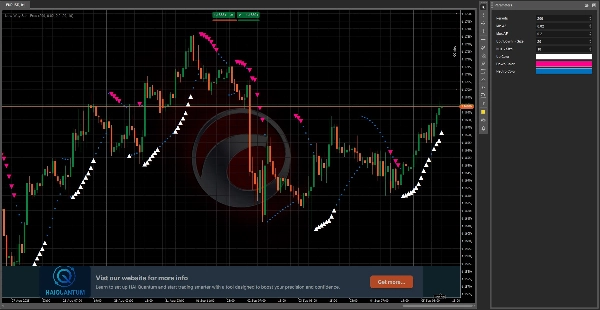
"New Way Sar - Free" 로고
지표
121 다운로드
버전 1.0, Sep 2025
Windows, Mac
5.0
리뷰: 1
"New Way Sar - Free" 업로드된 이미지
137
판매
10.69K
무료 설치

The Parabolic SAR, or "Stop and Reverse," is a dynamic technical analysis tool that helps traders identify potential trend reversals and set trailing stop-loss orders. Unlike traditional indicators, the Parabolic SAR creates a series of dots that follow the price movement, adjusting as the trend gains momentum.

Our modern version offers a fresh, intuitive approach to this classic indicator. By combining powerful, reliable signals with a clean and modern design, it helps traders easily visualize trend direction and potential entry or exit points. Whether you're a seasoned trader or just starting out, the Parabolic SAR: Modern Version provides the clarity and precision you need to navigate the markets with confidence.

지표 프로필
5.0
리뷰: 1
5
100 %
4
0 %
3
0 %
2
0 %
1
0 %
고객 리뷰
October 8, 2025
A fresh twist on the classic SAR! ⚙️ Fast, light, and easy to read. Great for spotting quick trend flips, but add filters to avoid false turns on choppy markets."
Prop
Forex
Signal
Indices
Supertrend
Commodities
Crypto
Stocks
트레이딩 봇, 지표, 플러그인 등 cTrader Store에서 제공되는 상품은 제3자 개발자에 의해 제공되며, 이는 단순히 정보 및 기술적 접근을 목적으로 제공된 것입니다. cTrader Store는 중개인이 아니며, 투자 조언, 개인별 추천 또는 향후 성과에 대한 어떠한 보장도 제공하지 않습니다.

이 작성자의 상품 더 보기

지표
VWAP
VWAP only timeframe
지표
Prop
Forex
+11
😎Read the description before purchasing💩
지표
Prop
Forex
+4
This indicator consists of 3 moving averages that can be configured to your liking, from the type of moving average....
지표
Grid
Prop
+16
This technical analysis indicator provides information on market sentiment, trend and price levels....
cBot
MACD
Commodities
This bot can automatically generate buy and sell orders based on three specific Fixed bugs.
지표
MACD
Forex
+1
😎Read the description before purchasing💩
지표
AI
Grid
+17
🔍 Discover All Candlestick Patterns… Absolutely Free!
지표
Grid
Prop
+16
With this Fibonacci retracement indicator, traders have full control over the retracement levels displayed on the chart.
지표
Prop
Forex
+12
Session One is a tool for marking from to, useful if you've set the hours you want to trade
지표
RSI
MACD
+2
A straightforward yet effective tool signals entry points for both buying and selling. Include 3 Moving Average
지표
Forex
Crypto
+3
a visually very powerful tool for analyzing "opposing forces".
지표
ATR
RSI
+5
🚀 HAI QUANTUM v4.0 | The Ultimate Quantum Terminal for cTrader (Smart Money & Algorithmic Trading)

좋아하실 만한 다른 항목

지표
Forex
Signal
The Pressure Gap indicator identifies sudden price jumps without using volume.
지표
Ichimoku Kinkō Hyō with fixed shift to 25 as Ctrader calculate it from 0 and values was wrong for Chikou Span and Kumo.
"Round Numbers" 로고
최고 평점
4.0
(3)
무료
지표
Grid
Prop
+5
Automatically draws major, minor, and trace support/resistance levels at round numbers
지표
Advanced Market Sessions ICT SilverBullet and ICT Killzones times
지표
Multi Timeframe Candle drawing. Draw Any candles from any timeframe on your chart :-)
지표
Forex
Crypto
+5
🔹This Indicator Predicts Market Reversals with 90% Accuracy | UNO KRI 📊
지표
Trading Sessions Indicator
지표
Forex
Crypto
+5
Automatically calculates the previous day’s high and low, determines the range, and then projects Fibonacci levels.
지표
ZigZag Smart Alert DEMO for cTrader DEMO VERSION 24 hours free trial! This is a DEMO version of the ZigZag Smart Aler
지표
Forex
Crypto
+3
Enhance Pitchfork & Price Channels in cTrader with customizable Equidistant and Fibonacci levels.
지표
SMC
Prop
+16
Pro M1 VWAP: Daily/Weekly/Monthly anchors with optional bands, editable colors & thickness—accurate on any chart.
지표
ATR
Prop
+15
🚀 Adaptive trailing stop that uses logarithmic normalized volatility....
지표
RSI
MACD
+1
Precision Supply & Demand zones indicator—automatically plots key buy/sell areas on your chart for smarter entries.
지표
Forex
Crypto
+2
HTF Candle
지표
Prop
Forex
+5
Tracks NY, London, Tokyo, Sydney sessions with custom visuals, and a real-time expanding range box and breakout High/Low
지표
Breakout
3 bar triangle = high below 2 day high, low above 2 day low
지표
Plot higher-timeframe Bollinger Bands for clearer structure, pullback zones, and breakout signals—without switching char
지표
ATR
RSI
+20
the indicator that hunts stop-loss liquidity before the big players do.
137
판매
10.69K
무료 설치