
Volume Meter
インジケーター
2 購入済
バージョン 1.0、Sep 2025
Windows、Mac
5.0
レビュー: 1
説明
📘 このインジケーターの機能
- バーごとの価格変動回数であるティックボリュームをヒストグラムとして表示します。
- FXでは、ブローカーが実際の取引量を提供することはほとんどないため、ティックボリュームが代用として使われます。
- 株式/CFD/先物では、実際の取引量が得られる場合があります。
- ボリュームの移動平均線(デフォルトは20期間)を重ねて表示します。
- これにより、現在のバーのボリュームが異常に高いか低いかを素早く判断する「基準線」として機能します。
🎯 確認としての使い方
このインジケーターは単独のシグナル生成器ではありません。代わりに、トレーダーは他の戦略のセットアップを確認するために使用します:
- ブレイクアウトの確認
-
- 価格がレジスタンスを上抜けるかサポートを下抜けた場合、ブレイクアウトのローソク足のボリュームが移動平均を上回っているかを確認します。
- 高いボリュームはより多くの参加者が動きの背後にいることを示し→ブレイクアウトの信頼性が高まります。
- 低いボリュームのブレイクアウトは偽のブレイクアウトの可能性が高くなります。
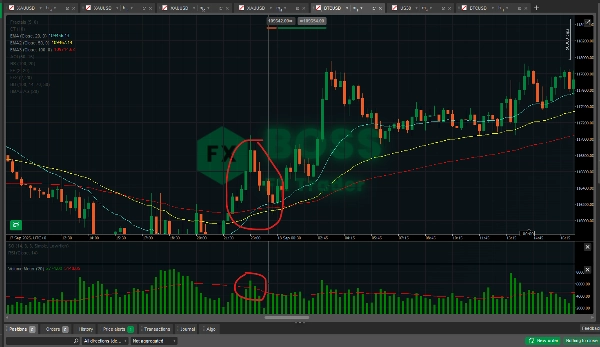
- トレンド継続 vs. 疲弊
-
- 強いトレンドでは、プルバックのローソク足はインパルスのローソク足に比べてボリュームが低いことが多いです。
- プルバックが低いボリュームで起こり、その後の動きが高いボリュームで再開する場合→トレンド継続の確認となります。
- トレンドの押しが続いているのに各押しごとにボリュームが減少している場合→疲弊の可能性があり、反転の準備をします。
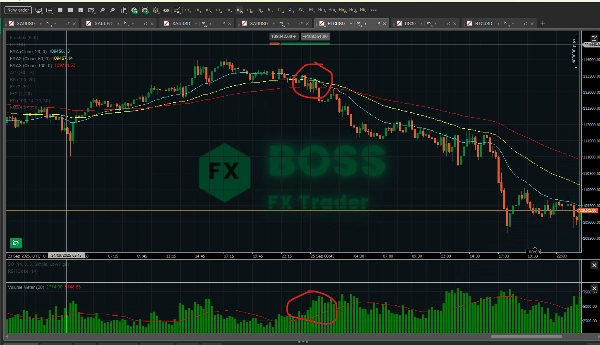
- 反転の確認
-
- 大きな反転ローソク足(ピンバー、包み足、フラクタル)はボリュームの急増が伴うとより強力です。
- 例:サポートでの強気ピンバーが高いボリュームを伴う場合=低いボリュームの同じピンバーより強い反転シグナル。
- 偽シグナルのフィルター
-
- メインのシステムが買い/売りシグナルを出しても、ボリュームが弱い(平均以下)場合は、そのトレードを見送ることができます。
- 過剰取引を減らし、ノイズをフィルターするのに役立ちます。
📊 効果
- FXの場合:ティックボリュームは実際の取引量と強い相関があることが示されています(多くの研究で70〜90%の相関)。したがって有用ですが、完璧ではありません。
- 株式/先物/CFDの場合:実際のボリュームを測定できるため、はるかに強力です。
- 確認として:価格アクションや他のインジケーター(例:EMA、RSI、フラクタル)と組み合わせて使うのが最適です。ボリュームだけに頼るのはリスクがあります。
- 強み:ブレイクアウトの確認、偽の動きのフィルター、疲弊の検出。
- 弱み:方向性を単独で予測しない — セットアップがある場合に信頼性を高めるだけ。
✅ 実用的なヒント:
インジケーターはトリガーではなくフィルターとして使いましょう。例えば:
- EMAのクロスオーバー(買いシグナル)を確認します。
- ボリュームが移動平均を上回っているか確認します。上回っていれば→トレードを実行。そうでなければ→待ちます。
このようにして、モメンタムが市場参加によって裏付けられている場合のみトレードします。
概要
AIによる概要
Volume Meter is a trading indicator that displays tick volume—the number of price changes per bar—as a histogram. In Forex markets, where real traded volume data is often unavailable, tick volume serves as a proxy, while in stocks, CFDs, and futures, real volume data may be used. The indicator overlays a moving average of volume (default 20-period) to provide a baseline, helping traders identify whether current volume is unusually high or low.
This tool is designed to confirm trading setups rather than generate standalone signals. It assists in validating breakouts by checking if breakout candles have volume above their moving average, indicating stronger market participation. It also helps distinguish trend continuation from exhaustion by comparing volume levels during pullbacks and impulse moves. Additionally, it supports reversal confirmation by highlighting volume spikes on significant reversal candles and filters false signals by advising caution when volume is weak despite buy or sell signals from other systems.
Volume Meter is applicable across various markets including Forex, stocks, indices, commodities, and cryptocurrencies. Its effectiveness is enhanced when combined with price action and other indicators such as EMA or RSI. The indicator aids in improving trade decision confidence by integrating volume analysis as a confirmation and filtering tool.
インジケーターのプロフィール
カスタマーレビュー
5.0
レビュー: 1
5 | 100 % | |
4 | 0 % | |
3 | 0 % | |
2 | 0 % | |
1 | 0 % |
カスタマーレビュー
October 1, 2025
the first 10 trades should stay boring, and the checklist becomes easier to follow.
ディスカッション
よくあるご質問
BTCUSD
Forex
Breakout
Indices
EURUSD
Commodities
GBPUSD
NZDUSD
Prop
Supertrend
Crypto
Stocks
XAUUSD
NAS100
USDJPY
cTrader Storeで入手可能な取引ボット、インジケーター、プラグインなどの商品は、第三者の開発者が提供するものであり、情報と技術の取得のみを目的としてご利用いただけます。cTrader Storeはブローカーではなく、投資助言や個人的な推奨を行うことも、将来のパフォーマンスを保証することもありません。
この作成者の他の商品


価格
登録日 29/05/2025
3.04M
取引数量
45.22K
獲得pips
29
販売
769
無料インストール