
Description
Indicateurs du magasin Pinescriptlabs : 🤖Pinescriptlabs Store cBots :
ICT Power of 3 (cBot) Gold & BTC BreakoutSession Pivots(nouveau)YieldShield"
SmartTrend Support &
Lignes de Résistance
Sessions de Gap de Valeur Juste
Structure Dynamique du Marché
Analyse des Points de Renversement
Fibonacci Linéaire
Régression Multi-échelles
Gradient de Tendance Dynamique
Biais de Chandelle Multi-Niveaux
Traceur
Support Automatique et
Lignes de Tendance de Résistance
Tous les Supports et
Niveaux de Résistance
Carte de Liquidation à Effet de Levier
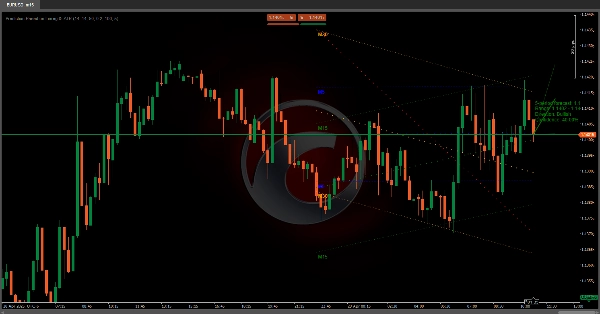
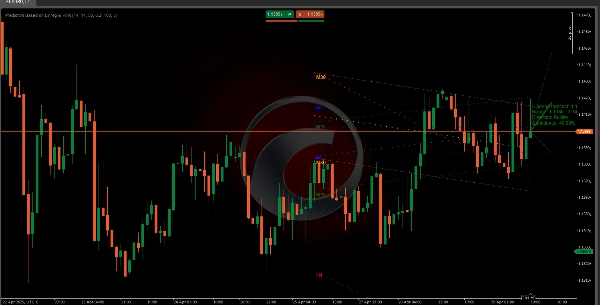
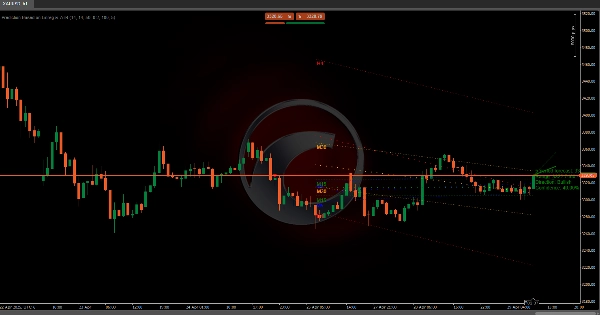
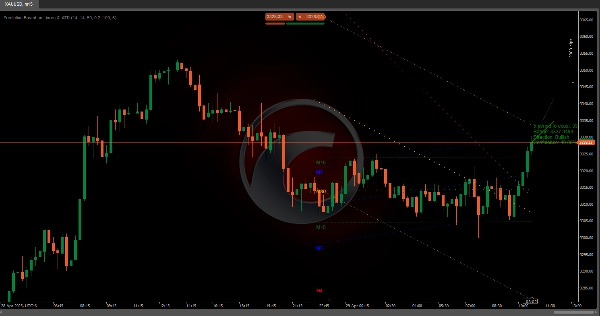
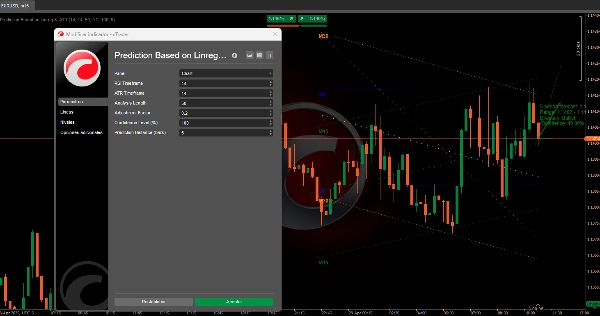
📈 Canal de Régression Multi-Échelles & Algorithme de Prédiction ATR
Ce système prédit le mouvement potentiel du prix d'un actif en combinant l'analyse de tendance multi-échelles 📊, la volatilité du marché 📉, et la confirmation par indicateurs techniques ✅. Son objectif est de projeter une fourchette de prix future avec une confiance mesurable, idéale pour identifier des opportunités risque-rendement à haute probabilité 💰.
🔧 Fonctionnement Étape par Étape
1️⃣ Analyse de Tendance Multi-Échelles
- Canaux de Régression à Travers les Échelles :
L'algorithme analyse simultanément quatre échelles temporelles différentes (du court au long terme). Pour chacune : -
- Calcule une ligne de tendance statistique basée sur le comportement historique des prix.
- Définit un canal de prédiction autour de cette ligne (en utilisant la volatilité passée pour fixer les bornes supérieures/inférieures).
- Influence Hiérarchique :
Les échelles temporelles plus courtes ont plus de poids dans la direction finale, reflétant leur sensibilité aux mouvements récents.
2️⃣ Intégration de la Volatilité (ATR) 🌊
- Ajustement Dynamique de la Volatilité :
Les prédictions s'adaptent aux conditions actuelles du marché : -
- Volatilité élevée → Projections plus larges
- Volatilité faible → Ajustements conservateurs
- Mise à l'Échelle de la Fourchette Future :
La bande de prédiction s'ajuste automatiquement en fonction de la volatilité attendue.
3️⃣ Système de Confirmation de Tendance ✅
Combine quatre signaux clés pour valider ou contester la direction basée sur la régression :
- Croisements de Moyennes Mobiles (confirmation de tendance)
- Oscillateurs de Momentum (évaluation de la force)
- Indicateurs de Volatilité (détection de surachat/survente)
- Analyse de Divergence (indices de retournement de tendance)
- Résultat : Un système de notation qui renforce ou remet en question la tendance prédite.
4️⃣ Calcul de Confiance 🎯
- Alignement des Échelles Temporelles :
La confiance augmente lorsque les tendances s'accordent à travers les échelles temporelles. - Seuil Défini par l'Utilisateur :
Les traders peuvent définir un niveau minimum de confiance pour filtrer uniquement les signaux à haute certitude.
5️⃣ Visualisation Intuitive 📉📈
- Ligne de Prédiction :
Montre le chemin central attendu (vert = haussier 🟢, rouge = baissier 🔴, gris = neutre ⚪). - Bandes de Fourchette :
Mettent en évidence la zone de mouvement de prix la plus probable, ajustée selon la volatilité. - Étiquette d'Information :
Résume le prix projeté, la fourchette, la direction et le niveau de confiance.
🌟 Avantages Clés
- Approche Multi-Dimensionnelle : Combine tendance, volatilité & momentum pour réduire les faux signaux.
- Auto-ajustable : S'adapte automatiquement aux marchés instables ou en tendance.
- Métriques Transparentes : La confiance quantifiable aide à gérer les attentes.
📌 Exemple Pratique
Si le système détecte :
- Tendance haussière sur les courtes échelles + confirmation du momentum
- Faible volatilité récente
- Forte concordance entre les échelles temporelles
→ Projette une hausse des prix avec une bande étroite et une haute confiance (par exemple, 85%) 🚀
Résumé
The ATR component dynamically adjusts the prediction bands to current market conditions, widening during high volatility and narrowing during low volatility periods. A trend confirmation system integrates four key signals—moving average crosses, momentum oscillators, volatility indicators, and divergence analysis—to validate or question the regression-based trend, producing a scoring system that indicates trend strength.
Confidence levels are calculated based on alignment of trends across timeframes, with user-configurable thresholds to filter signals by certainty. Visualization includes a central prediction line (color-coded for bullish, bearish, or neutral trends), range bands highlighting probable price zones, and an info label summarizing projected price, range, direction, and confidence.
The indicator supports markets including cryptocurrencies (e.g., BTCUSD), commodities (e.g., XAUUSD), and others. It aims to identify high-probability risk-reward opportunities by combining trend, volatility, and momentum analysis in a self-adjusting, transparent framework.


