
MACD Plus
Indicateur
504 téléchargements
Version 1.0, Oct 2025
Windows, Mac
5.0
Avis : 2
Description
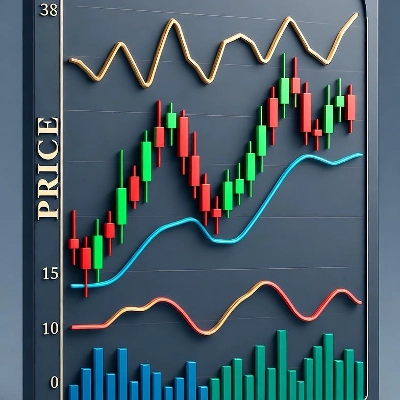
Nom de l'indicateur : Beautiful MACD – Version avancée
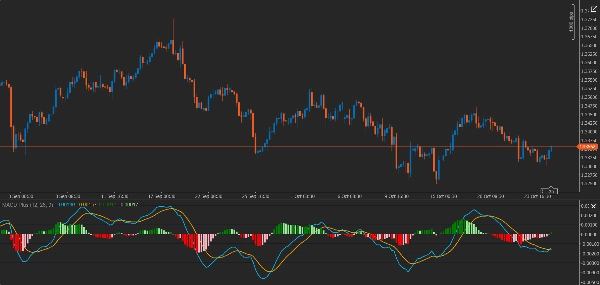
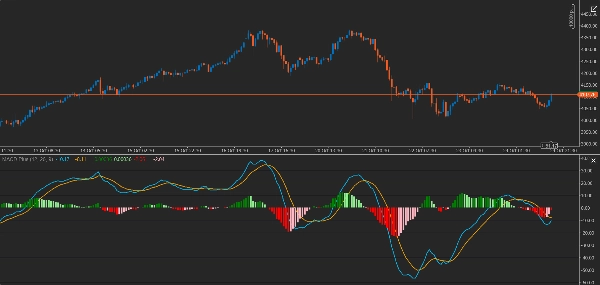
Beautiful MACD est une version avancée de l'indicateur MACD classique avec des fonctionnalités visuellement attrayantes pour simplifier l'analyse des tendances du marché.
Caractéristiques :
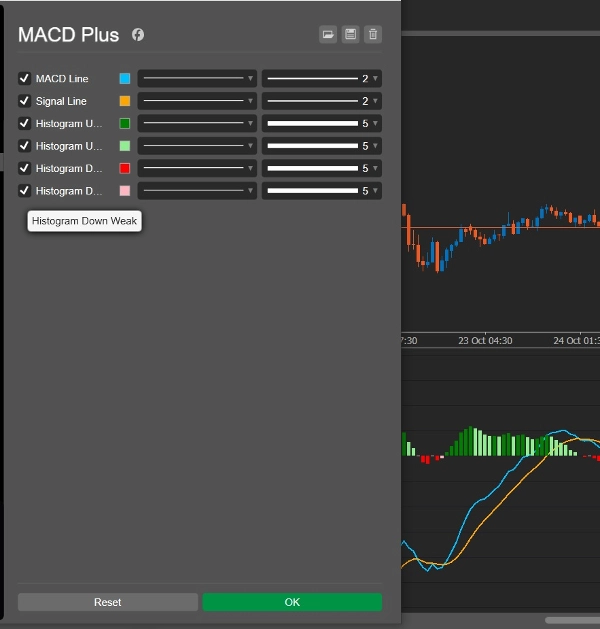
- Lignes MACD et Signal avec couleurs et épaisseurs personnalisables
- Quatre types d'histogrammes pour indiquer la force du momentum :
-
- Histogram Up Strong – Mouvement ascendant fort
- Histogram Up Weak – Mouvement ascendant faible
- Histogram Down Strong – Mouvement descendant fort
- Histogram Down Weak – Mouvement descendant faible
- Analyse visuelle facile pour les signaux d'entrée et de sortie
- Adapté à toutes les périodes et classes d'actifs
Cas d'utilisation :
- Identifier les changements de force de tendance
- Détecter les points d'entrée et de sortie optimaux
- Idéal pour les analystes techniques et les scalpers
-*-*-*-*-*-*-*-*-*-*-*-*-*-*-*-*-*-*-*-*-*-*-*-*-*-*-*-*-*-*-*-*-*-*-*-*-
نام اندیکاتور: Beautiful MACD – نسخه پیشرفته
توضیح کامل:
اندیکاتور Beautiful MACD نسخه ارتقاء یافته کلاسیک MACD است که با ویژگیهای بصری جذاب، تحلیل روند و قدرت حرکت بازار را آسانتر میکند.
ویژگیها:
- دو خط اصلی MACD و Signal با رنگهای متفاوت و ضخامت قابل تنظیم
- چهار نوع هیستوگرام برای نشان دادن قدرت حرکت:
-
- Histogram Up Strong: صعود قوی
- Histogram Up Weak: صعود ضعیف
- Histogram Down Strong: نزول قوی
- Histogram Down Weak: نزول ضعیف
- تحلیل بصری ساده برای تشخیص سیگنالهای ورود و خروج
- مناسب برای تمامی تایمفریمها و انواع داراییها
کاربرد:
- تشخیص تغییرات قدرت روند
- تشخیص نقاط ورود و خروج بهینه
- مناسب برای تحلیلگران تکنیکال و اسکالپرها
Résumé
Résumé IA
MACD Plus is an enhanced version of the classic MACD (Moving Average Convergence Divergence) indicator designed to facilitate market trend analysis through improved visual features. It displays MACD and Signal lines with customizable colors and thickness, alongside four distinct histogram types that represent momentum strength: strong upward, weak upward, strong downward, and weak downward movements. This visual differentiation aids in identifying changes in trend strength and supports easier interpretation of entry and exit signals. The indicator is suitable for all timeframes and asset classes, making it applicable across various markets including Forex and cryptocurrencies. It is particularly useful for technical analysts and scalpers seeking to detect optimal trading points and assess momentum dynamics.
Profil de l'indicateur
Avis clients
5.0
Avis : 2
5 | 100 % | |
4 | 0 % | |
3 | 0 % | |
2 | 0 % | |
1 | 0 % |
Avis clients
February 6, 2026
i love this macd its shows straight the coulours i need and for free i cant thank the maker enough up trend nice green down trend nice red love this one thank you for this indicator
Discussion
Questions fréquentes
Forex
Signal
Breakout
Crypto
MACD
Les produits disponibles sur cTrader Store, notamment les bots de trading, les indicateurs et les plug-ins, sont fournis par des développeurs tiers et mis à disposition à titre informatif et à des fins d'accès technique uniquement. cTrader Store n'est pas un courtier et ne fournit aucun conseil en investissement, aucune recommandation personnelle ni aucune garantie quant aux performances futures.
Plus de cet auteur


Prix
Depuis le 02/10/2025
1.9K
Installations gratuites