
Cumulative Delta Candles + VolumeProfile
Indicateur
2.15K téléchargements
Version 1.0, Feb 2025
Windows, Mac
4.5
Avis : 2
Description
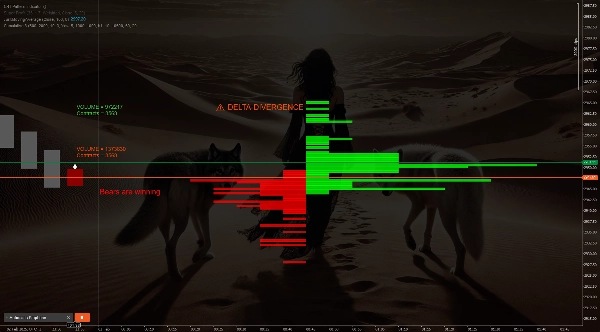
Chandeliers delta cumulatifs, profil de volume, avertissement de divergence delta + signaux d'achat et de vente, amusez-vous
Résumé
Résumé IA
This indicator combines cumulative delta candles with volume profile analysis to provide insights into market activity. It features delta divergence warnings and generates buy and sell signals based on the interplay of order flow and volume distribution. The tool is designed to assist traders in identifying potential market turning points by highlighting imbalances between buying and selling pressure. It integrates these elements into a single visual interface for use on trading charts.
Profil de l'indicateur
Avis clients
4.5
Avis : 2
5 | 50 % | |
4 | 50 % | |
3 | 0 % | |
2 | 0 % | |
1 | 0 % |
Avis clients
July 9, 2025
Pros: Combines cumulative delta and volume profile for precise liquidity and order flow analysis. Clear visualization, flexible settings. Stable performance. Cons: No alerts or tooltips. No history of previous profiles. Requires confirmation from additional tools for trading decisions.
April 21, 2025
Discussion
Questions fréquentes
Les produits disponibles sur cTrader Store, notamment les bots de trading, les indicateurs et les plug-ins, sont fournis par des développeurs tiers et mis à disposition à titre informatif et à des fins d'accès technique uniquement. cTrader Store n'est pas un courtier et ne fournit aucun conseil en investissement, aucune recommandation personnelle ni aucune garantie quant aux performances futures.


![Logo de "[Stellar Strategies] Inside Bar with Signals"](https://cdn.ctrader.com/image/webp/1d9e8bfa-3b2c-4440-bb37-5856902008a7_30683)


Prix
Depuis le 09/01/2025
11.78K
Installations gratuites