

Description
Ceux qui s'intéressent au trading savent à quel point il est important de prendre en compte la session précédente.
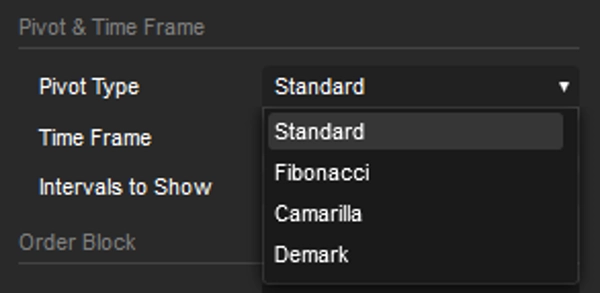
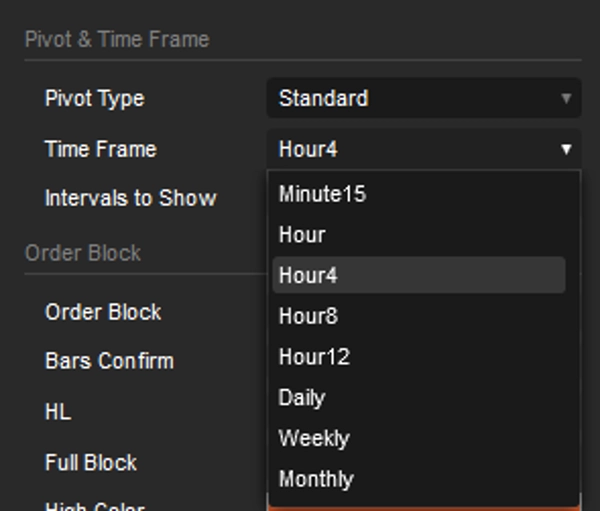
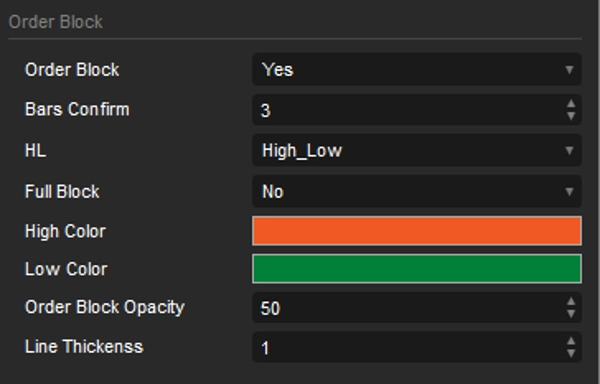
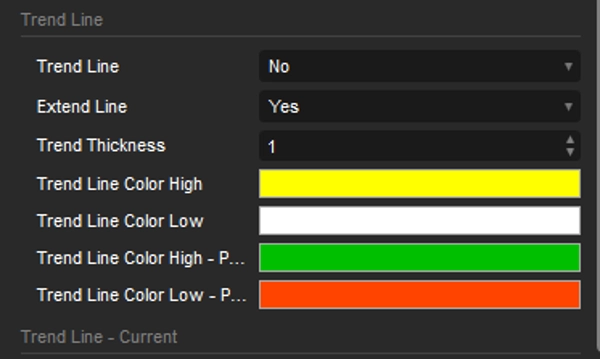
J'ai préparé cet indicateur Pivot, avec des intervalles allant de 15 minutes jusqu'à un mois, et il inclut des blocs d'ordres et des lignes de tendance. Les deux options sont basées sur les points les plus hauts et les plus bas de la session précédente.
La configuration par défaut est réglée pour une période de 5 minutes.
Le pivot est réglé sur 4 heures, et l'intervalle est de 5, ce qui signifie qu'il remonte 20 heures en intervalles de 4 heures. C'est parfait pour ceux qui tradent quotidiennement.
Cependant, si vous êtes un fan du Swing Trading, il vous suffit de changer l'intervalle du Pivot ; tout le reste s'ajuste automatiquement.
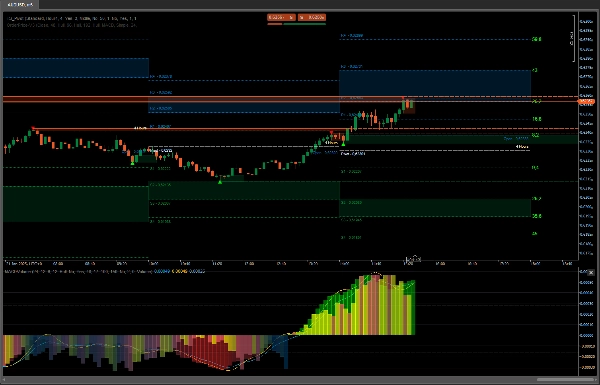
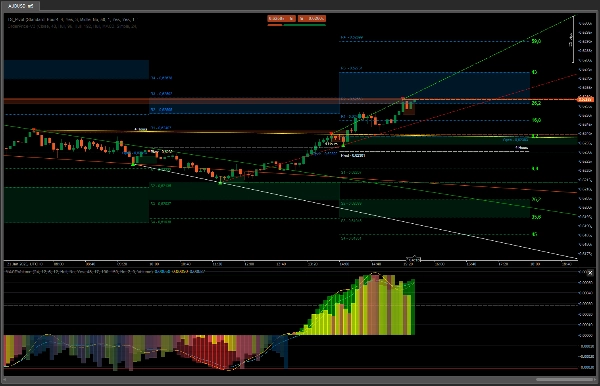
Les blocs d'ordres mettent en évidence des zones potentielles où le prix pourrait trouver un support ou une résistance, offrant un aperçu des possibles retournements ou continuations. En les combinant avec les lignes de tendance générées automatiquement pour la période choisie, les traders peuvent identifier plus précisément la direction potentielle du prix ainsi que les points d'entrée ou de sortie possibles. La capacité à visualiser ces lignes de tendance sur plusieurs périodes offre une compréhension plus complète de la structure du marché.
Avec des outils supplémentaires comme
OrderPrice V3 https://ctrader.com/products/397
NTMPICLL https://ctrader.com/products/327
Range Box Level https://ctrader.com/products/245
Or RangeBoxFibonacci https://ctrader.com/products/526
Market Session https://ctrader.com/products/94
MacdVolume https://ctrader.com/products/267
4MA https://ctrader.com/products/247
Vous serez invincible
Bonne chance 😀
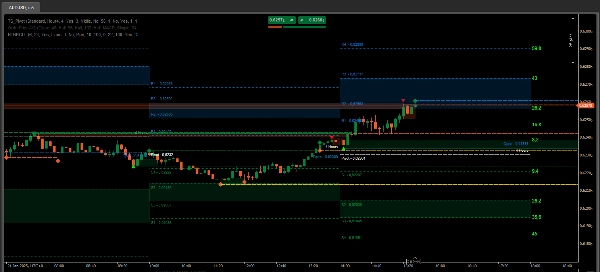
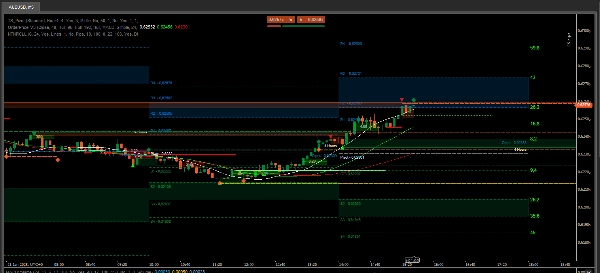
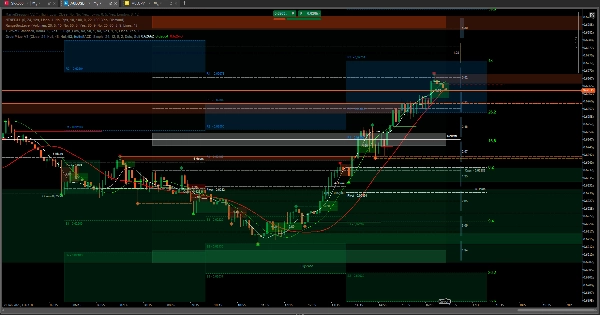
Dans le cas d'un achat, en observant les deux dernières images le comportement d'OrderPrice et des moyennes mobiles incorporées, lorsqu'une ligne verte apparaît et que la moyenne mobile est en dessous, c'est le moment parfait pour ouvrir une transaction d'achat.
Avec les données de la session précédente, vous pouvez déterminer jusqu'où le prix pourrait aller ou où une résistance pourrait se produire. S'il franchit ce niveau, il peut continuer jusqu'au deuxième point, qui pourrait être la zone neutre de RangeBoxLevel. S'il dépasse cela et qu'il n'y a aucun signe que les moyennes mobiles veulent changer de direction, le prix pourrait atteindre la zone de bloc d'ordres de la session précédente.
Dans la dernière image, il y a une capture d'écran d'une situation parfaite pour entrer et sortir d'une transaction. Le reste consiste simplement à observer et à tirer des conclusions.
Ces outils sont essentiels lorsqu'il s'agit de gagner grâce au trading d'actifs.
Résumé
Key features include the integration of order blocks and trend lines derived from previous session data. Order blocks identify potential support and resistance zones, aiding in spotting possible price reversals or continuations. The indicator automatically generates trend lines for the selected timeframe, helping traders assess market structure and potential price direction. Visualizing these trend lines across multiple timeframes enhances market analysis.
TS_Pivot can be used alongside complementary tools such as OrderPrice V3, NTMPICLL, Range Box Level, RangeBoxFibonacci, Market Session, MacdVolume, and 4MA to refine entry and exit decisions. By combining moving averages and order block signals, traders can identify optimal moments to open buy or sell positions. The indicator supports various markets including Forex, cryptocurrencies, commodities, indices, and stocks.
Avis clients
5 | 100 % | |
4 | 0 % | |
3 | 0 % | |
2 | 0 % | |
1 | 0 % |


