

Description
L'indice de pression de liquidité est un outil de qualité professionnelle conçu pour offrir aux traders une analyse approfondie des dynamiques cachées de la liquidité du marché. Contrairement aux oscillateurs traditionnels qui ne réagissent qu'au prix, l'indice de pression de liquidité combine le volume des ticks, la compression de la volatilité et le flux directionnel en une seule ligne facile à lire. Cela en fait un compagnon puissant pour les traders souhaitant comprendre si la pression d'achat ou de vente domine réellement derrière les chandeliers.
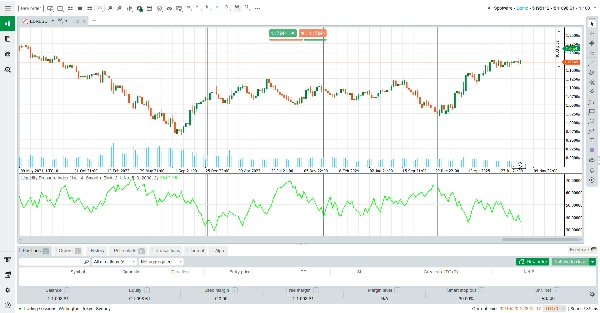
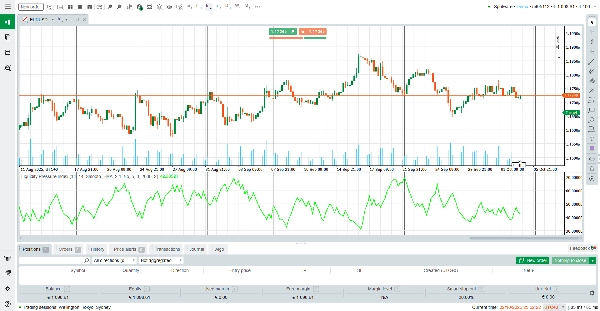
Au cœur de son fonctionnement, ALB calcule l'équilibre entre la liquidité d'achat accumulée et la liquidité de vente accumulée, en normalisant le résultat par rapport au volume de ticks roulant. La sortie est centrée autour du niveau neutre de 50. Des valeurs supérieures à 50 indiquent une liquidité d'achat plus forte, tandis que des valeurs inférieures à 50 soulignent une liquidité de vente plus forte.
Ce simple indicateur visuel permet aux traders d'évaluer instantanément le flux sous-jacent des ordres sans avoir besoin d'interpréter plusieurs indicateurs à la fois.
Comment lire l'indicateur
Ligne au-dessus de 50 : Le marché montre une liquidité d'achat plus forte. Cela soutient souvent la continuation haussière ou signale une demande cachée absorbant les ordres de vente.
Ligne en dessous de 50 : Le marché montre une liquidité de vente plus forte. Cela soutient souvent la continuation baissière ou signale une offre cachée absorbant les ordres d'achat.
Plate ou proche de 50 : La liquidité est équilibrée, suggérant une indécision ou une consolidation.
Options de lissage : Les traders peuvent choisir entre un lissage EMA ou KAMA pour réduire le bruit et se concentrer sur la tendance dominante de la liquidité.
Comment ça fonctionne
L'indicateur mesure d'abord la volatilité de la plage réelle (ATR) et la compare à la plage réelle du chandelier pour estimer la compression. Il combine ensuite cela avec le volume des ticks pour séparer la liquidité en attente (ordres en attente dans le carnet) de la liquidité exécutée (ordres déjà remplis). Selon la direction du chandelier, l'algorithme attribue une absorption cachée d'achat ou de vente. Enfin, le résultat est normalisé par rapport à une EMA roulante du volume des ticks, mis à l'échelle et lissé pour plus de clarté.
Le résultat est un indice de liquidité dynamique qui s'adapte aux conditions du marché et révèle la lutte entre acheteurs et vendeurs en temps réel.
Caractéristiques clés
Perspicacité axée sur la liquidité : Va au-delà du prix pour révéler la pression cachée d'achat/vente.
Lissage adaptatif : Choisissez entre EMA ou KAMA pour réduire le bruit.
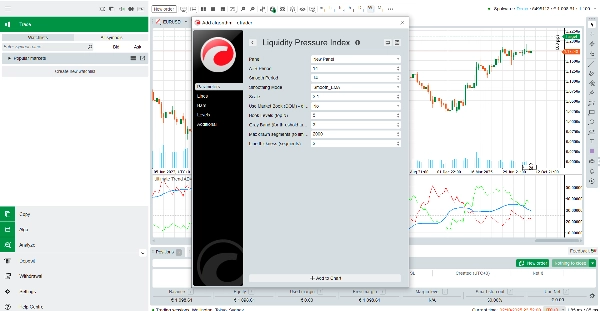
Paramètres personnalisables : Contrôlez la période ATR, la longueur du lissage, l'échelle et l'épaisseur de la ligne.
Performance optimisée : Conception légère avec limites de segments pour assurer un affichage fluide.
Pourquoi utiliser l'indice de pression de liquidité ?
Dans des marchés en mouvement rapide, le prix seul peut être trompeur. L'Advanced Liquidity Balance offre aux traders une perspective plus profonde, montrant si le marché est réellement soutenu par la liquidité ou si les mouvements se font avec une faible participation. Que vous soyez un scalpeur cherchant des déséquilibres à court terme ou un trader de swing confirmant la force de la tendance, l'indice de pression de liquidité fournit une lentille de liquidité professionnelle — et le meilleur, c'est qu'il est entièrement gratuit.
Téléchargez-le dès aujourd'hui et ajoutez une nouvelle dimension de clarté à vos décisions de trading.
Résumé
Avis clients
5 | 0 % | |
4 | 100 % | |
3 | 0 % | |
2 | 0 % | |
1 | 0 % |


![Logo de "High-Low Divergence [Iridio Capital]"](https://cdn.ctrader.com/image/webp/443c4661-7abb-40f1-842f-4b6ec560649b_40914)
