
High TF Plotter
Indicateur
435 téléchargements
Version 1.0, May 2025
Windows, Mac
4.6
Avis : 3
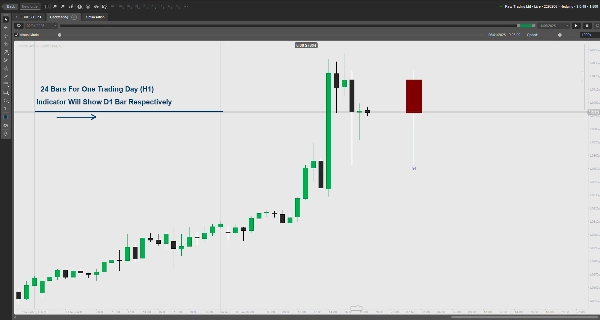
Trace les mouvements de prix en haute unité de temps sur des graphiques en unités de temps inférieures. Affiche l'ouverture/la fermeture, les mèches et les zones clés avec des couleurs haussières/baissières. Personnalisable.
Caractéristiques principales :
- Superpose les mouvements de prix en haute unité de temps (par exemple, journalier) sur des graphiques en unités de temps inférieures.
- Affiche des rectangles de prix d'ouverture/fermeture avec des couleurs haussières/baissières personnalisables.
- Met en évidence les zones de prime/remise des mèches pour les niveaux de prix clés.
- Marge configurable pour l'espacement du graphique.
- Gestion des erreurs pour les paramètres d'unité de temps invalides.
Veuillez laisser un avis pour nous faire savoir si cela vous est utile.
Profil de l'indicateur
4.6
Avis : 3
5 | 67 % | |
4 | 33 % | |
3 | 0 % | |
2 | 0 % | |
1 | 0 % |
Avis clients
January 27, 2026
It would have been very helpful if it were possible to configure the time for NY EST
August 18, 2025
Clear higher timeframe level plotting, customizable, lightweight. Cons: No auto-labels, no multi-timeframe overlays, no alerts.
May 29, 2025
Muito bom, mas se tivesse a linha de abertura, máxima e mínima seria perfeito. Obrigada.
Les produits disponibles sur cTrader Store, notamment les bots de trading, les indicateurs et les plug-ins, sont fournis par des développeurs tiers et mis à disposition à titre informatif et à des fins d'accès technique uniquement. cTrader Store n'est pas un courtier et ne fournit aucun conseil en investissement, aucune recommandation personnelle ni aucune garantie quant aux performances futures.
Plus de cet auteur


86.17M
Volume tradé
1.91M
Pips gagnés
3.57K
Installations gratuites