
Bar Explosion
インジケーター
208 ダウンロード数
バージョン 1.0、May 2025
Windows、Mac
説明
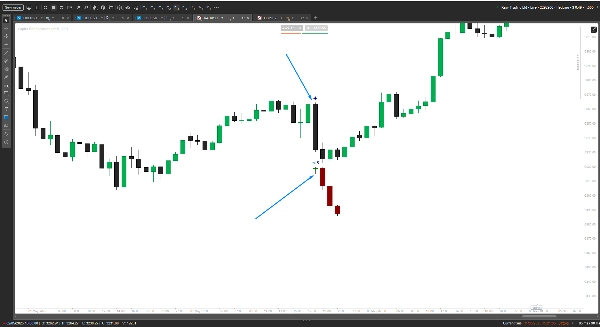
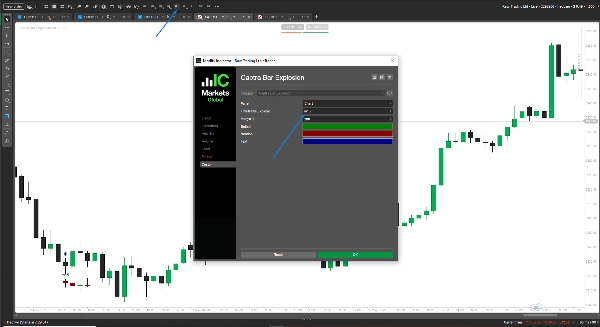
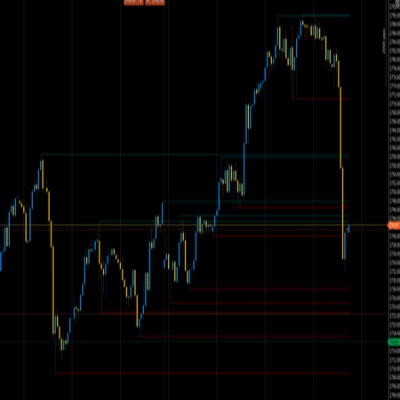
強力な Captra's Bars Explosion を解き放ち、あなたのトレーディングを支配するために設計された最高級のcTraderインジケーターです。この強力なツールは爆発的な ミニタイムフレームのローソク足ビジュアル をオーバーレイし、鋭い精度でトレンドを見つけることができます。タイムフレーム(例:Minute15)、色(強気/緑、弱気/ダークレッド)、およびマージン(デフォルト30ピップス)をカスタマイズしてあなたのスタイルに合わせてください。スキャルパーやスイングトレーダーに最適で、スムーズなパフォーマンスを備えたcTrader用に作られています。
役立ったかどうか、レビューをぜひお寄せください。
概要
AIによる概要
Bar Explosion is a cTrader indicator that overlays mini-timeframe candlestick visuals onto your main chart, enabling precise trend identification. Users can customize the indicator’s timeframe (e.g., 15 minutes), colors for bullish (green) and bearish (dark red) bars, and margin settings (default 30 pips) to suit different trading styles. Designed for scalpers and swing traders, it provides detailed, smaller timeframe bar information directly on higher timeframe charts, enhancing market analysis without switching views. The indicator is optimized for smooth performance within the cTrader platform.
インジケーターのプロフィール
カスタマーレビュー
0.0
レビュー: 0
カスタマーレビュー
この商品にはまだレビューがありません。お使いになったことがある方は、ぜひレビューをお願いします。
ディスカッション
よくあるご質問
cTrader Storeで入手可能な取引ボット、インジケーター、プラグインなどの商品は、第三者の開発者が提供するものであり、情報と技術の取得のみを目的としてご利用いただけます。cTrader Storeはブローカーではなく、投資助言や個人的な推奨を行うことも、将来のパフォーマンスを保証することもありません。
この作成者の他の商品


これも好きかも


価格
86.62M
取引数量
1.99M
獲得pips
3.66K
無料インストール