
説明
🚀 10,000人以上のトレーダーがすでに私たちのトップ インジケーター🏆
なぜプロが私たちを選ぶのかを発見してください – 最も強力なツールが cTrader(インジケーター、アルゴリズム、cBots)であなたを待っています。
👉 すべてのトップシステムはこちらから入手できます:
_______________________________________________
📌 マーケット構造インジケーター
· ✅ AdvancedMarket Structure: Bos, Choch, SwinLevels, Order Blocks, Market Structure&流動性ファインダー
· 🧱 オーダーブロック
· ⚖️ マーケットアンバランス
· ⛓️ BOS&CHOCH
· 🧠 ICTパワーオブ3
· 🌀 マーケットポラリティゾーン
_______________________________________________
🔚 スマートエグジットシステム
· 📍 トレーリングスマートアルゴリズム
_______________________________________________
📐 ジグザグインジケーター
· 🔍 ジグザグ価格流動性予測
· 🧭 S&R構造的ジグザグ
· ➖ ジグザグ
· 🎯 ジグザグ極端トラッカー
_______________________________________________
🧱 サポート&レジスタンスインジケーター
_______________________________________________
📊 トレンド&チャネルインジケーター
· 🔄 オートトレンドチャネル
· 📊 スーパートレンド
· 🧠 アダプティブトレンドチャネル
· 💥 チャネルブレイクアウトシステム
· ⭐ プレミアムSSLチャネル
· 🔁 リアクティブ移動平均
_______________________________________________
💧 ボリューム&流動性ツール
· 🔥 ボリュームPOCヒートマップ
· 📉 レバレッジ清算マップ
· 🔍 モメンタムフェアバリューギャップ
· 🕒 フェアバリューギャップセッション
_______________________________________________
⚡ モメンタム&RSIインジケーター
· 📈 RSIトレンドトリガー
· 🚀 ダイナミックレンジモメンタム
_______________________________________________
🔮 予測&投影ツール
· 📐 Linreg&ATRに基づく予測
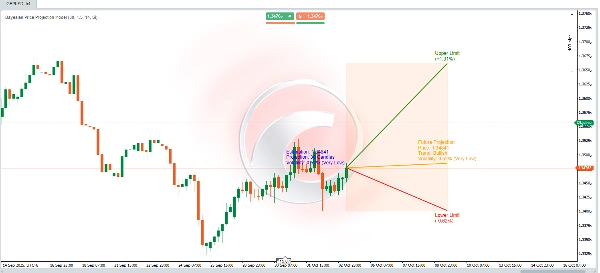
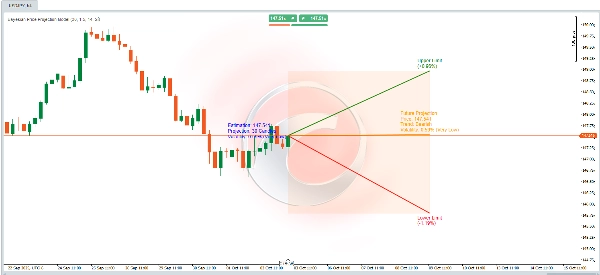
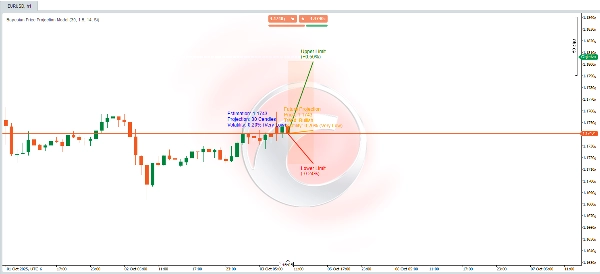
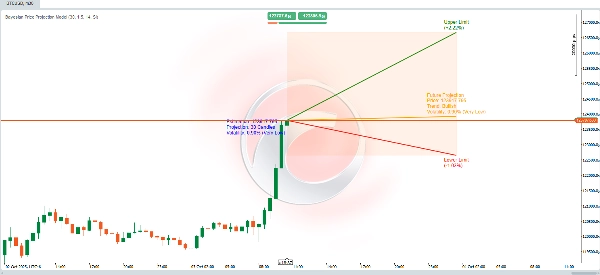
📊 ダイナミック価格予測アルゴリズム 📈
このアルゴリズムは、**統計計算**、**テクニカル分析**、および**ベイズ理論**を組み合わせて将来の価格を予測し、上限と下限を表す**不確実性の範囲**を提供します。計算は、市場の**トレンド**、**ボラティリティ**、および新高値または新安値に達する歴史的確率を考慮して予測を調整するように設計されています。
仕組みは次のとおりです:
🚀 将来価格予測
動的な計算により、3つの主要要素に基づいて将来の価格を推定します:
1. **トレンド**:市場が上昇または下降に傾いているかを定義します。
2. **ボラティリティ**:過去の変動に基づく予想変化の大きさを定量化します。
🧠 **ベイズ確率調整**
- 条件付き確率は**ベイズの公式**を使用して計算されます:
\[
P(A|B) = \frac{P(B|A) \cdot P(A)}{P(B)}
\]
これは条件付き情報を用いて将来のイベントをモデル化します:
- 価格が上昇トレンドの場合の新しい史上最高値に達する確率。
- 価格が下降トレンドの場合の新しい史上最安値に達する確率。
- これらの確率は、以下を考慮して将来の価格推定を洗練します:
- **高いボラティリティ**は極端なレベル(高値/安値)に達する可能性を高めます。
- **市場トレンド**は予想される価格変動の方向に影響を与えます。
🌟 **ボラティリティ計算**
- ボラティリティは14期間の**ATR(平均真の範囲)**インジケーターを使用して測定されます。これは価格変動の平均振幅を反映します。
- ボラティリティをパーセンテージで表すために、ATRを終値で割り、200を掛けて正規化します。
- ボラティリティは、より良い解釈のために(例:**非常に低い**、**低い**、**中程度**など)記述的レベルに分類されます。
---
🎯 **偏差限界(上限および下限)**
- 上限および下限は推定将来価格の周りの**予測範囲**を形成し、不確実性の枠組みを提供します。
- これらの限界はATRを以下で調整して計算されます:
- ユーザー定義の**乗数**(`factor_desviacion`)。
- 先に計算された**ベイズ確率**。
- 不確実性が時間とともに増加する原理を組み込んだ**予測期間の平方根**(`proyeccion_dias`)。
🔍 **モデルの解釈**
これは以下を組み合わせた**動的確率モデル**と見なせます:
- **テクニカル分析**(トレンドとATR)。
- **ベイズ理論**を用いた確率の洗練。
- 将来の価格変動と関連する不確実性を理解するのに役立つ**視覚的予測範囲**の提供。
⚡ 変動の激しい市場を分析する場合でも、強気/弱気シナリオを確認する場合でも、このツールは堅牢でデータ駆動型のアプローチを提供します!🚀


