
Coloring Trendline with arrows
インジケーター
5 購入済
バージョン 1.0、Jul 2025
Windows、Mac
4.0
レビュー: 1
説明
✅ スムーズな 色が変わるトレンドライン が方向に即座に適応します
✅ オプションの 上下矢印 で明確なトレンドシフトのシグナルを表示
✅ ノイズをフィルタリングして クリーンで信頼できるトレンドの変化 を強調
✅ トレンドフォロー、プルバック、リバーサルに 最適
✅ 完全にカスタマイズ可能: 期間、感度、矢印表示
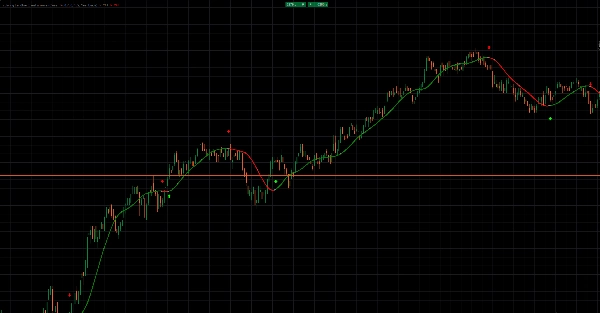
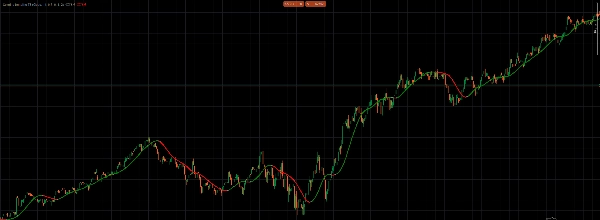
この 矢印付きカラーリングトレンドライン は、市場の方向をスムーズかつレスポンシブに表示し、余計な情報を排除します。
トレンドラインは動的に 強気相場では緑色、弱気相場では赤色 に変わり、トレンドの方向を即座に読み取れます。
モメンタムが反転すると、オプションの矢印が変化を示します — 上昇トレンドには緑の矢印、下降トレンドには赤の矢印。
これにより、市場のノイズによる誤シグナルを避けつつ、トレンドの転換点を早期に捉えることができます。
明確さを追求して設計されており、価格に滑らかに適応しながら強い方向性を維持します。
エントリーのタイミング、エグジットの管理、主要なトレンドとの整合性を保つのに最適です。
単独のトレンドツールとしても、既存の戦略と組み合わせて確認用にも使用できます。
クリーンなビジュアル。明確なシグナル。 自信を持ったトレンドトレード。
概要
AIによる概要
The Coloring Trendline with Arrows indicator provides a smooth, color-changing trendline that dynamically shifts green during bullish phases and red during bearish phases, offering an immediate visual of market direction. It incorporates a triple-EMA (T3MA) calculation blending six cascaded EMAs with a customizable volume factor to reduce lag and filter noise, enhancing trend signal clarity. Users can adjust sensitivity through period and volume factor inputs and set thresholds for clean trend confirmations. Optional up and down arrows mark trend shifts—green arrows indicate uptrends, red arrows signal downtrends—helping to identify trend pivots early while minimizing false signals. Designed for clarity and responsiveness, this indicator is suitable for trend following, pullbacks, and reversals. It can be used standalone or combined with other strategies to assist in timing entries and managing exits aligned with dominant trends. The indicator supports customization of period, sensitivity, and arrow display options.
インジケーターのプロフィール
カスタマーレビュー
4.0
レビュー: 1
5 | 0 % | |
4 | 100 % | |
3 | 0 % | |
2 | 0 % | |
1 | 0 % |
カスタマーレビュー
July 11, 2025
The small win here is it gives the trade idea another check. It should not replace the chart.
ディスカッション
よくあるご質問
Signal
Breakout
Scalping
SMC
Grid
AI
Martingale
cTrader Storeで入手可能な取引ボット、インジケーター、プラグインなどの商品は、第三者の開発者が提供するものであり、情報と技術の取得のみを目的としてご利用いただけます。cTrader Storeはブローカーではなく、投資助言や個人的な推奨を行うことも、将来のパフォーマンスを保証することもありません。
この作成者の他の商品


これも好きかも


![「[Stellar Strategies] MARSI Signal Plotter」ロゴ](https://cdn.ctrader.com/image/webp/7b2b8da6-8f8e-4646-8d4a-4710c516c01e_25567)


価格
59
販売
923
無料インストール