
説明
SRコマンダー
無料トライアル Big Brother: SR Commander マルチタイムフレーム https://ctrader.com/products/3833?u=ALGO-XL
SRコマンダー は、トレーダーが重要な市場レベルを特定し、価格の位置を瞬時に読み取り、ブレイクアウト、ブレイクダウン、リジェクションのシナリオに迅速に反応できるように設計された、cTrader用のクリーンでインテリジェントなサポート&レジスタンスインジケーターです。
不要なノイズでチャートを乱す代わりに、SRコマンダーは最も重要なものに焦点を当てます:現在の価格周辺の最も近い実行可能な サポート と レジスタンス レベルと、市場が 買い、売り、または 待機 状態にあるかを示すシンプルな視覚的ステータスシステムを組み合わせています。
これにより、すべてのチャートで手動でレベルをマークすることなく、市場の動きを迅速かつ構造的に把握したいトレーダーに特に役立ちます。
SRコマンダーの仕組み
SRコマンダーは最近の価格動向をスキャンし、選択されたルックバックロジック内で最も重要なローソク足を特定します。これをボラティリティに基づく計算と組み合わせて、現在の市場価格周辺に意味のあるサポートとレジスタンスレベルを構築します。
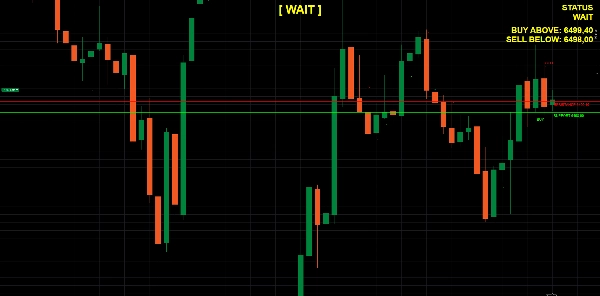
検出されたレベルから、インジケーターは自動的に 価格の下の最も近いサポート と 価格の上の最も近いレジスタンス を選択します。これらのレベルはチャート上に明確な水平線として直接描画され、価格が現在市場構造内のどこに位置しているかを即座に理解できます。
これらのレベルが確立されると、SRコマンダーは現在の市場状況を評価します:
- 買い / ブレイクアウト
価格が調整可能なブレイクアウトバッファーを伴って最も近いレジスタンスレベルを上回って終値を付けた場合、インジケーターはこれを強気のブレイクアウトと解釈します。 - 売り / ブレイクダウン
価格が調整可能なブレイクダウン閾値を伴って最も近いサポートレベルを下回って終値を付けた場合、インジケーターはこれを弱気のブレイクダウンと解釈します。 - 待機
価格がサポートとレジスタンスの間に留まっている場合、インジケーターは市場がまだレンジ内にあり、明確な方向性のブレイクが発生していないことを示します。
このロジックはトレーダーが感情的な意思決定を避け、市場構造をより客観的に読み取るための枠組みを提供します。
実際のチャートでの意思決定のために構築
SRコマンダーは単にラインを描くだけではありません。トレーダーが価格が そのライン上で何をしているか を理解するのを助けるよう設計されています。
ブレイクアウトやブレイクダウンの条件を検出するだけでなく、インジケーターは以下も識別できます:
- 買いのバウンスシグナル 価格がサポートをテストし、強気の確認とともに再び上回って終値を付けたとき
- 売りのリジェクションシグナル 価格がレジスタンスをテストし、弱気の確認とともに再び下回って終値を付けたとき
- 過去のブレイクアウトおよびブレイクダウンマーカー 以前の市場反応をチャート上で直接確認できるように
- 過去のサポート/レジスタンスの挙動を研究したいトレーダー向けのオプションの 過去の買いおよび売りの反応ポイント
これにより、SRコマンダーはライブ分析だけでなく、チャートレビュー、パターン認識、トレードジャーナリングにも役立ちます。
クリーンな視覚構造
SRコマンダーの強みの一つはそのシンプルさです。インジケーターは重要な情報を提供しながら視覚的に明確であるよう設計されています。
以下を表示できます:
- 最も近い サポート と レジスタンス レベル
- オプションの 価格ラベル をライン上に
- 現在の市場状況を示すコンパクトな ダッシュボード
- 大きな中央のステータスメッセージ(例: 買い、売り、または 待機)
- 過去のブレイクアウトおよびブレイクダウンイベントの履歴シンボル
その結果、活発な市場状況でも読みやすく効率的なチャートが維持されます。
スマートなフィルタリングロジック
SRコマンダーには信号の質を向上させる実用的なフィルターも含まれています。
例えば、サポートとレジスタンスの間の距離が小さすぎる状況を無視することができます。現在のゾーンが狭すぎる場合、市場は圧縮されすぎているか、意味のある意思決定には不明瞭かもしれません。そのような場合、インジケーターは低品質のシグナルを強制する代わりに 待機 状態を返します。
これにより誤発動が減り、よりクリーンな取引機会に集中できます。
主な特徴
- 関連するサポートおよびレジスタンスレベルを自動検出
- 現在の価格周辺の最も近い実行可能なレベルを強調表示
- ブレイクアウト、ブレイクダウン、および 待機 の市場状態を識別
- オプションの 買いのバウンス と 売りのリジェクション シグナル
- 過去のブレイクアウトおよびブレイクダウンの視覚化
- 調整可能なブレイクアウトバッファーとバウンス許容度
- オプションでクローズドキャンドルの確認を使用可能
- クリーンダッシュボードと大きなステータス表示
- 迅速なチャート読み取りのためのシンプルな視覚レイアウト
このインジケーターが適している人
SRコマンダーは価格構造とレベルベースの意思決定に依存するトレーダーに適しており、以下を含みます:
- ブレイクアウトトレーダー
- プライスアクショントレーダー
- 日中トレーダー
- スイングトレーダー
- よりクリーンなチャート構造を求める裁量トレーダー
- サポートとレジスタンス周辺で迅速な視覚的確認を求めるトレーダー
リバーサル、リテスト、レンジブレイク、または継続ムーブを取引する場合でも、SRコマンダーはチャート上の最も重要なレベルに集中するのを助けます。
SRコマンダーを使う理由
多くのインジケーターが注目を争うと、市場はしばしば混乱します。SRコマンダーは、テクニカル分析で最も重要な概念の一つである サポートとレジスタンス を通じて、トレーダーに構造化され読みやすい市場の見方を提供することでその問題を解決します。
レベル検出、ボラティリティ認識ロジック、バウンス/リジェクション認識、ブレイクアウトステータスを一つのクリーンなツールに組み合わせることで、SRコマンダーはトレーダーが次の3つの重要な質問に迅速に答えるのを助けます:
- 価格は今どこにありますか?
- 市場はブレイクアウトしていますか、ブレイクダウンしていますか、それともまだレンジ内ですか?
- 価格は重要なレベルで強さやリジェクションを示していますか?
これにより、より規律あるワークフローが生まれ、トレーダーはより明確に、かつチャートのノイズを減らして意思決定ができるようになります。
重要な注意事項
SRコマンダーはテクニカル分析の意思決定支援ツールとして設計されています。勝利を保証するものではなく、常にご自身の市場コンテキスト、確認方法、リスク管理ルールと併用して使用してください。
概要
SR Commander identifies breakout and breakdown scenarios when price closes beyond the nearest resistance or support levels, respectively, with adjustable buffers. It also signals buy bounces and sell rejections when price tests and reacts to these levels. Historical breakout and breakdown events are marked on the chart for review and pattern recognition.
The indicator features smart filtering to avoid low-quality signals, such as ignoring zones where support and resistance are too close. Its clean visual layout includes optional price labels, a large status message, and historical reaction points, facilitating fast and structured market analysis.
SR Commander supports traders focusing on price structure and level-based strategies, including breakout, price action, intraday, and swing trading across various markets such as forex, indices, commodities, stocks, and cryptocurrencies. It serves as a decision-support tool to enhance clarity and reduce chart noise in technical analysis.


