
Market Polarity Zones
インジケーター
209 ダウンロード数
バージョン 1.0、Jul 2025
Windows、Mac
🚀 10,000人以上のトレーダーがすでに当社のTOPインジケーターを使用しています 🏆 …そしてコミュニティは成長し続けています!
なぜプロが私たちを選ぶのかを発見してください – cTraderの最も強力なツール (インジケーター + アルゴリズム + cBots)があなたを待っています。
👉 当社のすべてのTOPシステムをここで入手:
Pinescriptlabsストアインジケーター: Pinescriptlabs ストアcBots : (cBot) Gold & BTC BreakoutSession Pivots(新着)
高度なマーケット構造:Bos、Choch、SwinLevels、オーダーブロック、 マーケット構造&流動性ファインダー (新着)
トレーリングスマートアルゴリズム (新着)
マーケットポラリティゾーン 📊
このアルゴリズムは何をするのですか?
マーケットポラリティゾーン は、市場分析を簡素化する高度なインジケーターで、強気 🚀 または弱気 🐻 フェーズを自動的に識別し、トレンド反転が起こりやすい重要なレベルをマークします。
対象:
- プライスアクショントレーダー
- スイングトレーダー
- スキャルパー、...迅速に市場の方向性と正確なエントリー/エグジットポイントを見つける必要がある方。
ロジックはどのように機能しますか?
このアルゴリズムは、異なる期間の2つのHull移動平均(HMA)を使用してモメンタムの変化を検出し、以下のように動的レベルを設定します:
- HMAのクロスオーバーを検出してトレンドの変化を特定します。
- 自動レベルを設定:
-
- 強気のクロスオーバー → 安値をサポートレベルとしてマーク
- 弱気のクロスオーバー → 高値をレジスタンスレベルとしてマーク
- 新しいクロスオーバーが発生するまで 現在のレベルを維持します。
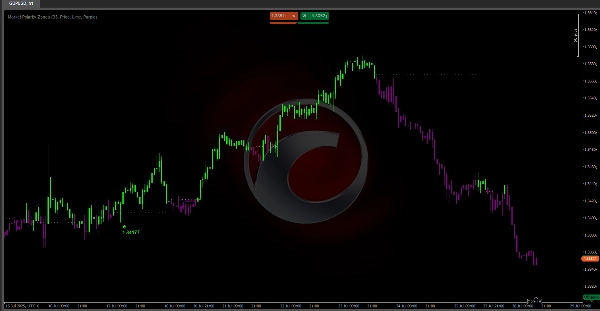
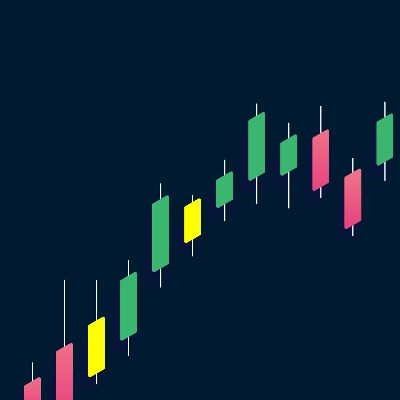
チャートで見るもの:
🎨 直感的なカラースキーム:
- 緑のローソク足 🟢: レベルより上の価格(強気ゾーン – 買いを狙う)
- 紫のローソク足 🟣: レベルより下の価格(弱気ゾーン – 売りを狙う)
📉 動的レベルライン:
- 点線の水平線 が現在のポラリティレベルを示します
- レベルが有効な間は自動的に延長されます
- レベルが安定した時のみ表示されます
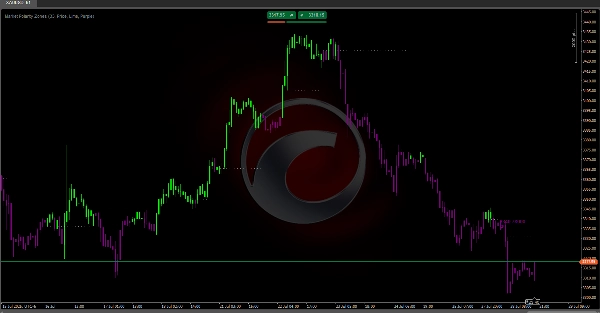
⚠️ 反転アラート:
特定のパターンが形成されると矢印ラベルが表示されます:
- 🔻 弱気反転(紫のラベル):
-
- パターン: 価格が上昇 → 失敗 → レベルを下回る
- 意味: 強気の圧力が弱まり、弱気ゾーンへの移行の可能性
- 🔺 強気反転(緑のラベル):
-
- パターン: 価格が下落 → 反発 → レベルを上回る
- 意味: 買い手がレベルを守り、強気ゾーンへの移行の可能性
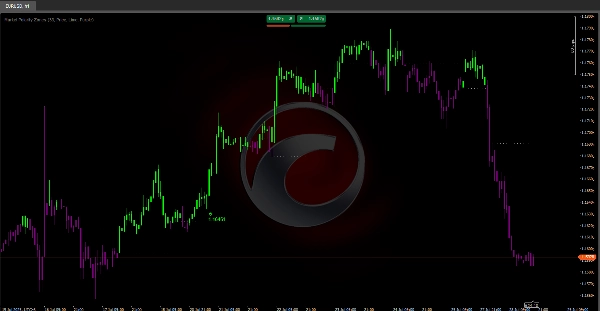
ℹ️ ラベル情報:
- 「価格」: 正確なブレイクアウト失敗ポイントを表示します – 正確なストップや重要なレジスタンス/サポートの特定に使用してください。
- 「ボリューム」: 直近3本のバーのボリューム合計 – 反転に実際の市場参加があるかを確認します。
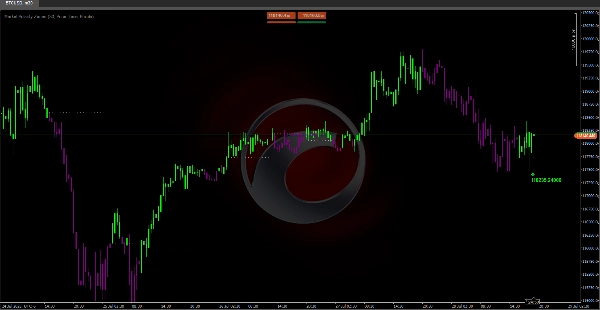
推奨設定:
- 期間: 33(デフォルト)– ほとんどの市場でうまく機能します
- ラベルデータ: レベルの精度には「価格」、確認には「ボリューム」
- 色: 最高の視覚的コントラストのためにライム/パープルを維持 🎨
インジケーターのプロフィール
0.0
レビュー: 0
カスタマーレビュー
この商品にはまだレビューがありません。お使いになったことがある方は、ぜひレビューをお願いします。
cTrader Storeで入手可能な取引ボット、インジケーター、プラグインなどの商品は、第三者の開発者が提供するものであり、情報と技術の取得のみを目的としてご利用いただけます。cTrader Storeはブローカーではなく、投資助言や個人的な推奨を行うことも、将来のパフォーマンスを保証することもありません。


これも好きかも


![「High-Low Divergence [Iridio Capital]」ロゴ](https://cdn.ctrader.com/image/webp/443c4661-7abb-40f1-842f-4b6ec560649b_40914)


登録日 03/10/2024
158
販売
36.39K
無料インストール