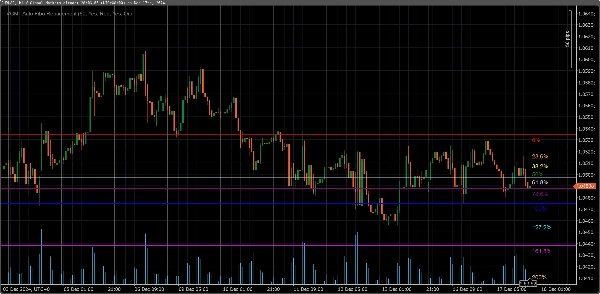
โบรกเกอร์และ Props
สำหรับธุรกิจ
00
Days
:
00
Hours
:
00
Minutes
:
00
Seconds
VGM - Auto Fibo Retracement
"VGM - Auto Fibo Retracement" โลโก้
ตั้งแต่ 17/12/2024
ติดตั้งฟรี
923
"VGM - Auto Fibo Retracement" ภาพที่อัปโหลด

This Auto Fibonacci Retracement Indicator automatically calculates and draws Fibonacci retracement levels on the chart based on the highest high and lowest low within a customizable lookback period. Users can configure colors and enable/disable specific Fibonacci levels, including popular extensions above 100% such as 127.2%, 161.8%, 200%, and 261.8%.

Key Features:
1. **Automatic Swing Detection**: Detects swing highs and lows dynamically within the chosen lookback period.
2. **Customizable Levels**: Enable/disable specific Fibonacci levels as per preference.
3. **Color Settings**: Choose individual colors for each level for better visual distinction.
4. **Extended Levels**: Includes commonly used extensions (127.2%, 161.8%, 200%, and 261.8%) for trend continuation analysis.
5. **Real-Time Updates**: Levels automatically adjust to changes in market conditions.

Ideal For:
- Traders using Fibonacci retracement and extensions for entry/exit levels.
- Users who need a clean, flexible, and automated Fibonacci tool.


Build by VantoFX. https://vantofx.com Free for all.

4.5
รีวิว: 2
5
50 %
4
50 %
3
0 %
2
0 %
1
0 %
รีวิวจากลูกค้า
August 10, 2025
This is helpful my friend, thanks for the upload :)
July 9, 2025
Pros: Automatically detects swing points and plots Fibonacci retracement levels. Easy to use, customizable, works across timeframes. Cons: No tooltips or alerts. Lacks template saving and historical swing tracking. Requires additional confirmation tools for reliable trading.
นอกจากนี้คุณยังอาจชอบ
เรตติ้งสูง
ฟรี
EKVWAP
This is an advanced VWAP indicator (Anchored or non-Anchored) that allows you to customize all the aspects of it.
Vishal Volume Profile v2.0
Volume Profile plots traded volume at each price level, highlighting high activity zones of precise support & resistance
ยอดนิยม
$ 15
/
$30
LevelMaster SR
LevelMaster S/R: Pinpoint key support & resistance zones with precision. Perfect for traders of all levels Trade smarter
เรตติ้งสูง
ฟรี
Free Volume Profile v2.0
ICT Killzone and Sessions high_low
This indicator is an essential tool for traders seeking to visualize key trading sessions on their charts.
ยอดนิยม
$ 15
NTNPICLL
NTNPICLL is a tool to check the best trading hours for the assets and also includes the highest and lowest point
เรตติ้งสูง
ฟรี
Order Flow Ticks v2.0
ใหม่
$ 15
DailyMA
Daily moving averages, simplified. Displays 3 daily moving averages on lower timeframes with selectable MA types.
VolumeRenkoRange
Volume for Renko/Range
RSI T3 overbought and oversold area
Bar Explosion
cTrader indicator with mini-timeframe candlesticks. Customize timeframe, colors, margins. Perfect for traders.
FREEE Tradingview Economic Calendar on Chart
Customizable window inside your platform, access to any website Calendar Was Free for early users now -50%
LDE - Market Sessions
🇫🇷 Visualisez vos sessions de marché et OPR d'un coup d’œil 🇬🇧 Visualize your market sessions & OPR at a glance !
VegaXLR - Unlimited Trendline Alerts
This is an indicator that can alert you about trendlines, horizontal lines and vertical lines.
อินดิเคเตอร์
NAS100
NZDUSD
Martingale
+26
Dynamic Trend Flux
Dynamic Trend Flux is a colored momentum oscillator based on the classic fast/slow EMA difference plus a signal line.
WaveWeisBarForce
Wave Weis Bar Force - is an indicator that applies the logic of Volume waves (Weis) to determine accumulation
Average Cost Price
Average Cost Price helps you keep track of your open positions on the chart. In doing so, it provides lines and explanat
RSI
RSI Pro Tool – Overbought & Oversold Made Easy