
ตัวบ่งชี้นี้อิงจากการวิเคราะห์ price action 📈 เพื่อระบุการเปลี่ยนแปลงในโครงสร้างตลาดและพื้นที่สำคัญที่น่าสนใจ ด้านล่างนี้คือสรุปอย่างละเอียดเกี่ยวกับวิธีการทำงาน:
การตรวจจับจุดเปลี่ยนและการสร้างรูปแบบ Zigzag 🔄
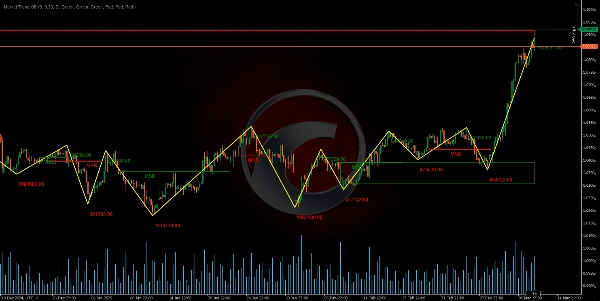
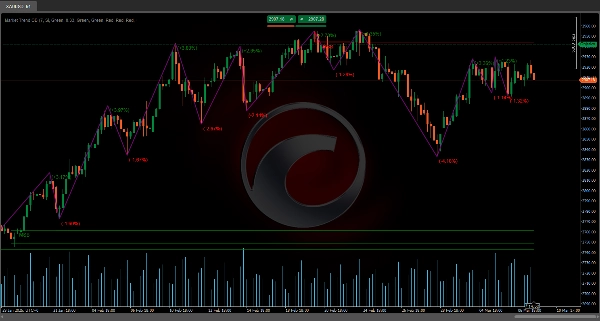
ช่วงเวลาที่กำหนด (โดยพารามิเตอร์ความยาว) จะถูกวิเคราะห์เพื่อระบุจุดสูงและต่ำสัมพัทธ์ โดยการเปรียบเทียบราคาภายในช่วงเวลานั้น pivot points (จุดเปลี่ยนทิศทาง) จะถูกตรวจจับ ซึ่งจะสร้าง รูปแบบ zigzag ⚡ รูปแบบนี้ช่วยแยกแยะเมื่อเกิด price reversal ขึ้น
การสะสมปริมาณและการคำนวณความเบี่ยงเบน 📊
ในระหว่างกระบวนการตรวจจับ pivot tick volume จะถูกสะสมในช่วงที่ประเมิน นอกจากนี้ยังคำนวณความแตกต่างเป็นเปอร์เซ็นต์ระหว่างราคาพิวอทเพื่อกำหนดว่าการเคลื่อนไหวมีความสำคัญเพียงพอหรือไม่ ความเบี่ยงเบนนี้จะถูกเปรียบเทียบกับเกณฑ์ที่กำหนด ซึ่งช่วยยืนยันว่าการเปลี่ยนแปลงในโครงสร้างนั้น เป็นจริง ✅
การกำหนดการแตกโครงสร้างตลาด (MSB) 🚨
ตัวบ่งชี้จะประเมินสองพิวอทสุดท้าย (ไม่ว่าจะเป็นจุดสูงหรือต่ำ) และโดยการใช้ retracement factor (ได้รับแรงบันดาลใจจากระดับ Fibonacci) เพื่อกำหนดว่ามี การแตกโครงสร้าง เกิดขึ้นหรือไม่
- ถ้าหลังจากทำลายจุดสูงเก่า ราคาเริ่มสร้าง lower lows จะมีการเปลี่ยนไปสู่ โครงสร้างขาลง 🐻
- ในทำนองเดียวกัน ถ้าหลังจากทำลายจุดต่ำเก่า ราคาเกิด higher highs จะถือว่าเป็นการเปลี่ยนไปสู่ โครงสร้างขาขึ้น 🐂
การเปลี่ยนแปลงนี้ถูกตีความว่าเป็น Market Structure Break (MSB).
การระบุ Order Blocks และ Breakout Boxes 📦
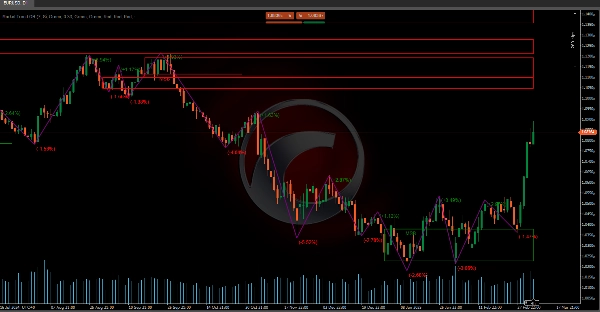
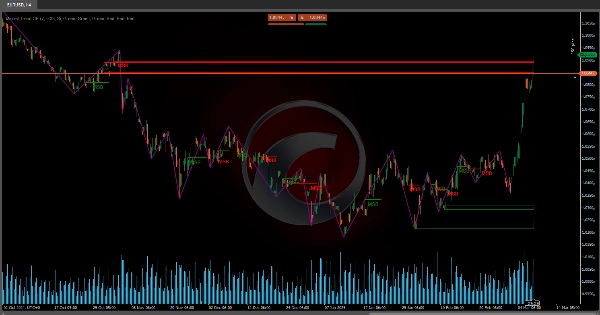
เมื่อพบ MSB จะมีการกำหนดโซนสำคัญตาม price action ก่อนหน้า:
- Order Blocks (OB) 🧱: โซนเหล่านี้ถูกระบุว่าเป็นพื้นที่ที่เกิดการเคลื่อนไหวสำคัญสุดท้ายก่อนการเบรค ในโครงสร้างขาลง เทียนขาขึ้นแท่งสุดท้ายก่อนจุดสูงใหม่จะถูกนำมาใช้; ในโครงสร้างขาขึ้น เทียนขาลงแท่งสุดท้ายก่อนจุดต่ำใหม่จะถูกใช้
- Breakout Boxes (BB) 📈: กำหนดในลักษณะเดียวกันแต่พิจารณาช่วงเพิ่มเติมเพื่อยืนยันว่าราคาทะลุระดับก่อนหน้า
โซนเหล่านี้ช่วยกำหนดพื้นที่ที่มีกิจกรรมเข้มข้นและอาจทำหน้าที่เป็น แนวรับหรือแนวต้าน ในอนาคต
การแสดงข้อมูล Zigzag ที่เกี่ยวข้อง 📊
นอกจากการวาดลำดับของพิวอทแล้ว ตัวบ่งชี้ยังรวมข้อมูลเพิ่มเติม:
- Reversal Price 💹: บันทึกค่าที่แน่นอนที่ตรวจพบการเปลี่ยนแปลงแนวโน้ม
- Reversal Percentage Change 🔄: คำนวณเปอร์เซ็นต์ความแตกต่างระหว่างราคาพิวอทใหม่กับพิวอทก่อนหน้า เพื่อแสดงขนาดของการเปลี่ยนแปลง
- Accumulated Volume 📉: แสดงผลรวมของ tick volume ในช่วงที่นำไปสู่การสร้างพิวอท
ข้อมูลนี้ช่วยให้ประเมิน ความแข็งแกร่งและความเกี่ยวข้อง ของการเคลื่อนไหวโดยไม่ต้องพึ่งพาสมมติฐาน เพราะอิงจากการคำนวณที่ชัดเจน
โดยสรุป เครื่องมือนี้วิเคราะห์ price action เพื่อตรวจจับเมื่อตลาดเปลี่ยนแนวโน้ม (MSB) และกำหนดโซน (order blocks และ breakout boxes) ที่อาจเป็นกุญแจสำคัญสำหรับ การตัดสินใจซื้อขาย 💼 การผสมผสานรูปแบบ zigzag กับ การวิเคราะห์ปริมาณ และ ความเบี่ยงเบนเป็นเปอร์เซ็นต์ ให้ภาพรวมที่ครอบคลุมของโครงสร้างตลาด โดยให้ข้อมูลที่แม่นยำเกี่ยวกับ จุดกลับตัว และ ความแข็งแกร่งของการเคลื่อนไหว 💪
ตัวบ่งชี้ Ctrader Store:
Dynamic Market Structure
Analysis of Turning Points
Fibonacci Linear
Regression Multi-timeframe
Multi-Level Candle Bias
Tracker
Auto Support and
Resistance Trend Lines
5 | 100 % | |
4 | 0 % | |
3 | 0 % | |
2 | 0 % | |
1 | 0 % |


