
Rsi + Volume
อินดิเคเตอร์
707 ดาวน์โหลด
เวอร์ชัน 1.0, Mar 2025
Windows, Mac
5.0
รีวิว: 3
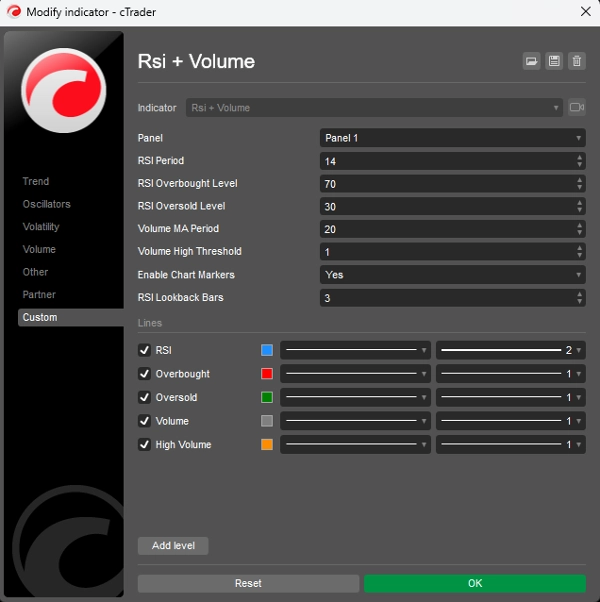
ตัวบ่งชี้นี้รวม RSI (ดัชนีความแข็งแกร่งสัมพัทธ์) กับการวิเคราะห์ปริมาณเพื่อสร้างสัญญาณการซื้อขายที่น่าเชื่อถือมากขึ้น มันทำงานบนหลักการที่ว่าการเคลื่อนไหวของราคาที่สำคัญควรมีปริมาณสูงเพื่อยืนยันความแข็งแกร่งของการเคลื่อนไหว
ส่วนประกอบหลัก:
- การวิเคราะห์ RSI:
-
- วัดความเร็วและการเปลี่ยนแปลงของการเคลื่อนไหวของราคาในช่วง 0-100
- ระบุสภาวะที่ซื้อมากเกินไป (เหนือ 70) และสภาวะที่ขายมากเกินไป (ต่ำกว่า 30)
- ช่วยในการสังเกตจุดกลับตัวที่เป็นไปได้ในตลาด
- การวิเคราะห์ปริมาณ:
-
- เปรียบเทียบปริมาณปัจจุบันกับค่าเฉลี่ยเคลื่อนที่ของปริมาณล่าสุด
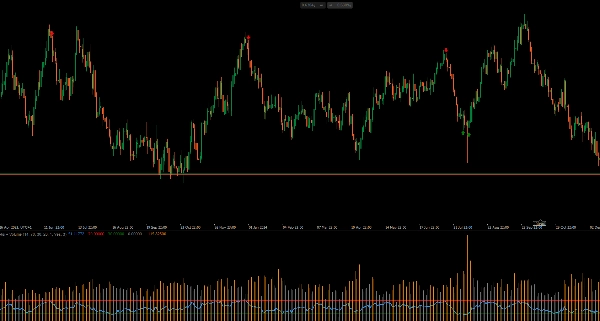
- เน้นช่วงเวลาที่มีปริมาณสูง (แท่งฮิสโตแกรมสีส้ม)
- ยืนยันความแข็งแกร่งเบื้องหลังการเคลื่อนไหวของราคา
- การสร้างสัญญาณ:
-
- สัญญาณซื้อ: เมื่อ RSI ข้ามเหนือระดับขายมากเกินไป (30) พร้อมกับปริมาณสูง
- สัญญาณขาย: เมื่อ RSI ข้ามต่ำกว่าระดับซื้อมากเกินไป (70) พร้อมกับปริมาณสูง
- สัญญาณภาพปรากฏโดยตรงบนแผนภูมิ (ลูกศรสีเขียวขึ้นสำหรับซื้อ, ลูกศรสีแดงลงสำหรับขาย)
วิธีการใช้งาน:
- มองหาสัญญาณซื้อเมื่อราคากำลังอยู่ในแนวโน้มขาลงและ RSI แสดงสภาวะขายมากเกินไป
- มองหาสัญญาณขายเมื่อราคากำลังอยู่ในแนวโน้มขาขึ้นและ RSI แสดงสภาวะซื้อมากเกินไป
- ปริมาณที่สูงขึ้นยืนยันความแข็งแกร่งของสัญญาณ
- ปรับพารามิเตอร์ (ช่วงเวลา RSI, เกณฑ์ปริมาณ) ให้ตรงกับกรอบเวลาการซื้อขายของคุณ
ตัวบ่งชี้นี้ช่วยกรองสัญญาณเท็จโดยต้องการการยืนยันทั้งจาก RSI และปริมาณที่สูงกว่าค่าเฉลี่ย ทำให้มีความน่าเชื่อถือมากกว่าการใช้ RSI เพียงอย่างเดียว
โปรไฟล์อินดิเคเตอร์
5.0
รีวิว: 3
5 | 100 % | |
4 | 0 % | |
3 | 0 % | |
2 | 0 % | |
1 | 0 % |
รีวิวจากลูกค้า
October 12, 2025
Hello, the RSI +volume indicator is perfect, but it needed to have something: when the little arrow appears on the chart, it could show a notification or an alarm. Would you be able to add that alarm or notification in cTrader?
August 12, 2025
Pros: Combines RSI and volume for stronger trading signals. Works well when RSI threshold intersects with high volume spikes. Lightweight and clear visuals. Cons: No alerts or tooltips. Lacks template saving. May generate noise on low-volume timeframes without additional filters.
Signal
Indices
RSI
ผลิตภัณฑ์ที่มีให้บริการผ่าน cTrader Store รวมถึงบอทการเทรด อินดิเคเตอร์ และปลั๊กอิน มีให้บริการโดยนักพัฒนาบุคคลที่สามและมีไว้เพื่อวัตถุประสงค์ในการเข้าถึงข้อมูลและทางเทคนิคเท่านั้น cTrader Store ไม่ใช่โบรกเกอร์และไม่ได้ให้คำแนะนำการลงทุน คำแนะนำส่วนบุคคล หรือการรับประกันผลการดำเนินงานในอนาคต


ตั้งแต่ 21/02/2025
466.3M
ปริมาณการเทรด
180.83K
Pips ที่ได้กำไร
21
การขาย
6.78K
ติดตั้งฟรี