
คำอธิบาย
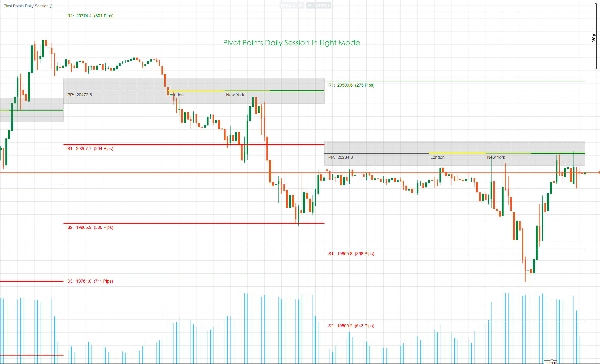
นี่คือสูตรสำหรับการคำนวณจุด Pivot มาตรฐาน:
PP = (High + Low + Close)/3
S1 = (PP * 2) – High
S2 = PP – (High – Low)
S3 = Low – 2(High – PP)
R1 = (PP * 2) – Low
R2 = PP + (High – Low)
R3 = High + 2(PP – Low)
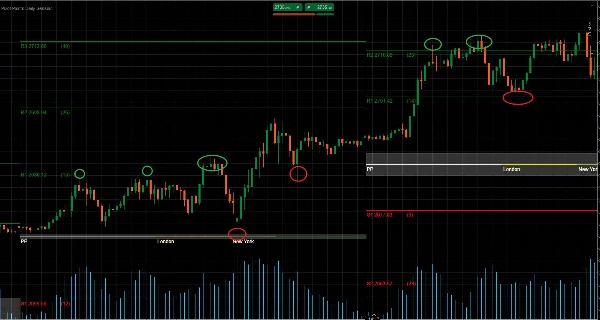
จุด Pivot สามารถใช้เพื่อระบุแนวโน้มโดยรวม เนื่องจากการเคลื่อนไหวผ่านจุด Pivot ไปทางด้านบนบ่งชี้ถึงแนวโน้มขาขึ้น ขณะที่ในทางตรงกันข้าม เมื่อราคายังคงลดลงต่ำกว่าจุด Pivot ในช่วงเซสชัน จะบ่งชี้ถึงแนวโน้มขาลง
ในตลาดที่เคลื่อนไหวในช่วงขอบเขต เทรดเดอร์สามารถขาย (เปิดสถานะสั้น) ที่แนวต้านและซื้อ (เปิดสถานะยาว) ที่แนวรับได้อย่างง่ายดาย ตัวอย่างเช่น หากตลาดถูกจำกัดระหว่าง R1 และ S1 คำสั่งซื้อจะถูกวางไว้รอบๆ S1 และคำสั่งขายจะถูกวางไว้รอบๆ R1
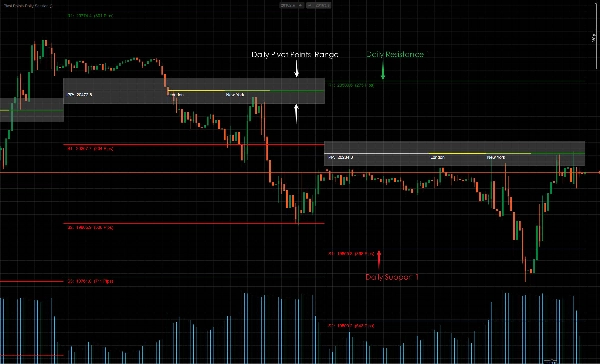
ในตลาดที่มีแนวโน้ม จุด Pivot ที่เกี่ยวข้องจะทำหน้าที่เป็นจุดอ้างอิงสำหรับตลาดที่มีการย้อนกลับเพื่อกลับมาดำเนินแนวโน้มหลักต่อไป ตัวอย่างเช่น หากราคาสูงกว่า PP ในช่วงแนวโน้มขาขึ้นแต่ต่ำกว่า R2 เทรดเดอร์สามารถวางคำสั่งซื้อที่มีกำไรได้รอบๆ R1
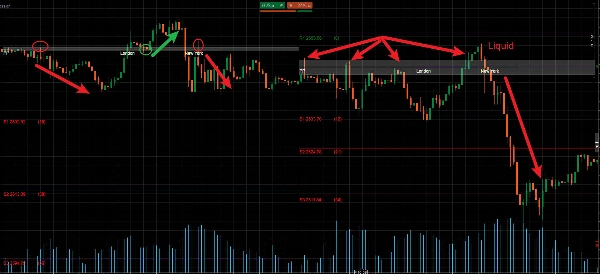
ระดับแนวรับและแนวต้านมีแนวโน้มที่จะถูกทำลายในบางช่วงของตลาด ช่วงเวลาการเบรกเอาต์เหล่านี้สามารถมอบโอกาสในการเทรดมากมายในตลาด จุด Pivot ยังสามารถใช้เพื่อเทรดการเบรกเอาต์ของราคาในตลาดได้
การเบรกเอาต์ของราคาเกิดขึ้นเมื่อราคาทะลุผ่านระดับแนวรับหรือแนวต้านที่มีอยู่และเปลี่ยนบทบาทอย่างมีประสิทธิภาพ ตัวอย่างเช่น หากเกิดการเบรกเอาต์ลงที่ S2 เส้น Pivot จะไม่ใช่เส้นแนวรับอีกต่อไปและจะถูกพิจารณาเป็นเส้นแนวต้านแทน
ในสถานการณ์นี้ จะพิจารณาเฉพาะคำสั่งขายที่ต่ำกว่า S2 เท่านั้น และเส้น Pivot อื่นๆ สามารถใช้เป็นแนวทางในการตั้งจุดหยุดขาดทุนและทำกำไร จุดหยุดขาดทุนสำหรับคำสั่งขายสามารถวางไว้เหนือ S2 และ S1 โดยมีเป้าหมายกำไรที่ S3 และต่ำกว่า
中文说明:
枢轴点可用于识别整体趋势,因为价格向上突破枢轴点表明上升趋势。与此同时,相反的情况,即价格在交易时段内持续跌破枢轴点,则表明下降趋势。
在区间震荡市场中,交易者可以简单地在阻力位做空(卖出)和在支撑位做多(买入)。例如,如果市场在R1和S1之间波动,买单将放置在S1附近,卖单放置在R1附近。
在趋势市场中,相关的枢轴点将作为回调市场恢复主要趋势的参考点。例如,如果在上升趋势中价格高于PP但低于R2,交易者可以考虑在R1附近设置有利可图的买单。
支撑位和阻力位在某些市场情况下必然会被突破。这些突破期可以在市场中提供许多交易机会。枢轴点也可用于交易市场中潜在的价格突破。
价格突破发生在价格冲破现有的支撑位或阻力位并有效转换其角色时。例如,如果在S2处发生向下突破,该枢轴线将不再是支撑线,而将被视为阻力线。
在这种情况下,只有在S2下方才会考虑卖单,其他枢轴线可以指导止损和止盈的设置。卖单的止损可以设在S2和S1上方,盈利目标设在S3及以下。
สรุป
รีวิวจากลูกค้า
5 | 100 % | |
4 | 0 % | |
3 | 0 % | |
2 | 0 % | |
1 | 0 % |
!["[Hamster-Coder] Pivot Points MTF" โลโก้](https://cdn.ctrader.com/image/webp/4c143e5a-309c-40e3-a578-f04d1e133ffa_31159)


