KAMAKeltner
Chỉ báo
Phiên bản 1.0, May 2025
Windows, Mac
4.0
Đánh giá: 2
Mô tả
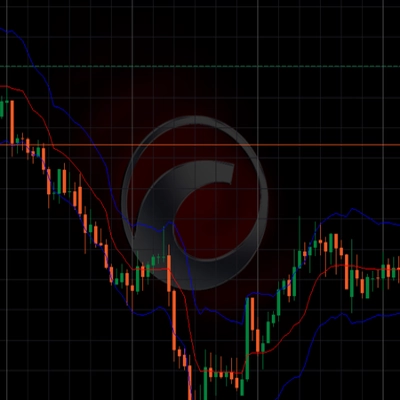
KAMA Keltner kết hợp sức mạnh của Trung bình Động Thích ứng của Kaufman (KAMA) với động lực đã được chứng minh của Kênh Keltner, tạo ra một dải biến động phản ứng nhanh, tự điều chỉnh phù hợp với điều kiện thị trường theo thời gian thực.
Không giống như các kênh truyền thống, phiên bản này phản ứng nhanh hơn với sự thay đổi xu hướng trong khi lọc bỏ nhiễu, nhờ vào động cơ làm mượt thích ứng của nó. Lý tưởng cho:
- Chiến lược hồi quy về trung bình – xác định chính xác các vùng mua quá mức/bán quá mức
- Hệ thống bứt phá – thích ứng linh hoạt với sự mở rộng biến động
- Vào và ra theo xu hướng – tín hiệu rõ ràng trong môi trường dao động và xu hướng
Được xây dựng cho các nhà giao dịch yêu cầu độ chính xác, khả năng thích ứng và tốc độ – dù bạn đang giao dịch lướt sóng, giao dịch swing hay chạy các mô hình thuật toán.
Tóm tắt
Tóm tắt AI
KAMA Keltner is a technical indicator that integrates Kaufman's Adaptive Moving Average (KAMA) with Keltner Channels to form a responsive, self-adjusting volatility band. This adaptive channel adjusts dynamically to real-time market conditions, providing faster reaction to trend changes while filtering out market noise through its smoothing engine. It is designed to support various trading strategies, including mean reversion by identifying overbought and oversold zones, breakout systems by adapting to volatility expansions, and trend-following entries and exits with clear signals in both ranging and trending markets. The indicator is suitable for traders employing scalping, swing trading, or algorithmic models who require accuracy, adaptability, and speed in their analysis.
Hồ sơ chỉ báo
Đánh giá của khách hàng
4.0
Đánh giá: 2
5 | 0 % | |
4 | 100 % | |
3 | 0 % | |
2 | 0 % | |
1 | 0 % |
Đánh giá của khách hàng
May 14, 2025
May 11, 2025
Pretty decent as a backup check, especially in trend days. The result needs a journal.
Thảo luận
Câu hỏi thường gặp
Breakout
Scalping
Các sản phẩm có sẵn trên cTrader Store, bao gồm bot giao dịch, chỉ báo và plugin, được cung cấp bởi các nhà phát triển bên thứ ba và chỉ nhằm mục đích cung cấp thông tin và tiếp cận kỹ thuật. cTrader Store không phải là nhà môi giới và không cung cấp lời khuyên đầu tư, khuyến nghị cá nhân hay bất kỳ đảm bảo nào về hiệu suất trong tương lai.
Sản phẩm khác của tác giả này


![Logo "[CB] Pivot Points Pro"](https://cdn.ctrader.com/image/webp/43463c82-67b0-4f10-a4ba-901bba091d81_32594)


![Logo "[Hamster-Coder] Moving Average MTF"](https://cdn.ctrader.com/image/webp/b11b98b1-194d-4b8e-b00e-d611826ad159_31226)


Giá
Kể từ 02/02/2025
1
Lượt bán