
説明
📊 日次ピップレンジダッシュボード(セッションに合わせたADRツール)
この日次ピップレンジダッシュボードは、リアルタイムの日次レンジ統計をチャート上に直接表示するプロフェッショナルトレーディングユーティリティであり、ブローカーのUTCセッションに完全に合わせられています。
精密なトレーダー向けに設計されたこのツールは、真のセッションベースの日次境界を使用して高値-安値のピップレンジを計算し、市場のコンテキストとボラティリティ分析のための強力なローリング統計を提供します。
🔥 主な特徴
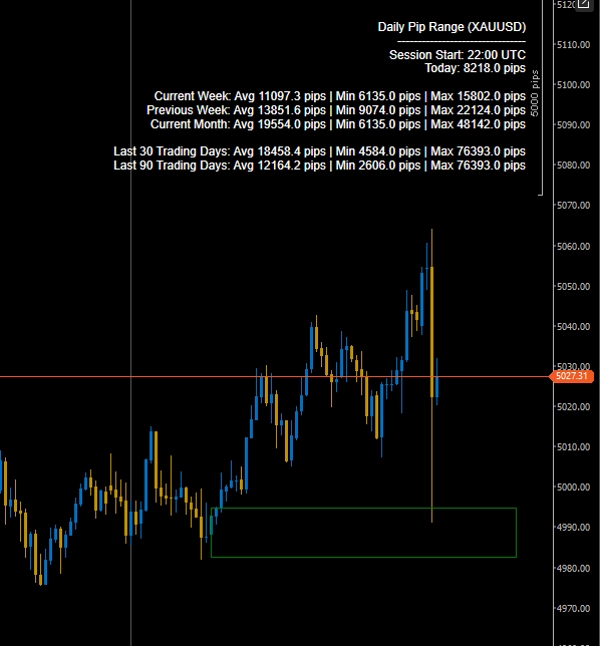
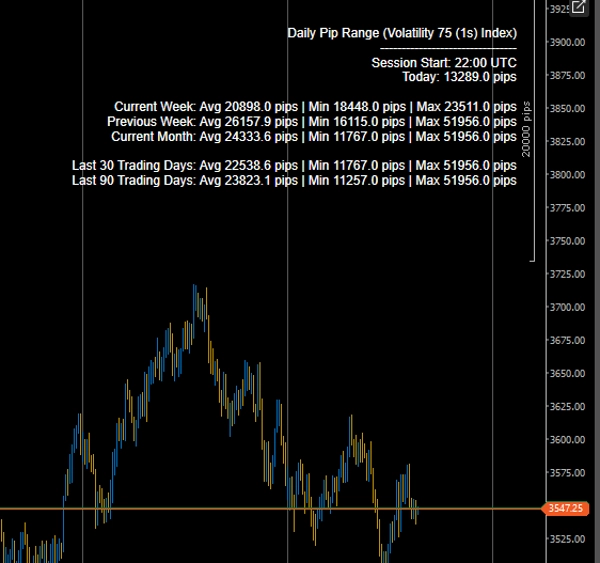
✅ 本日のライブ日次レンジ(ピップの高値–安値)
現在のセッションのピップレンジがリアルタイムで更新されます。
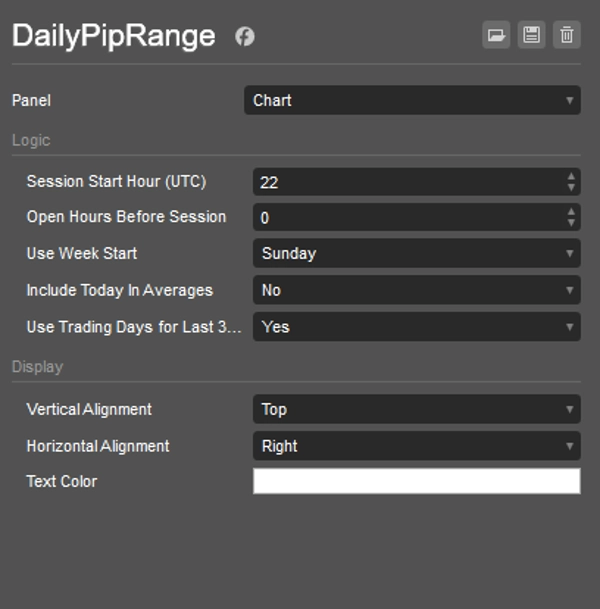
✅ セッションに合わせた計算(UTC制御)
以下を定義します:
- セッション開始時間(UTC)
- セッション前のオープン時間
これにより、日次統計がブローカーの取引日に一致し、NYクローズの整合性や機関スタイルの分析に最適です。
✅ 高度な統計的内訳
各期間について、インジケーターは以下を表示します:
- 平均日次レンジ
- 最小日次レンジ
- 最大日次レンジ
含まれる期間:
- 今週
- 先週
- 今月
- 過去30日間
- 過去90日間
✅ 取引日またはカレンダー日切替
以下から選択可能:
- 過去30/90カレンダー日
- 過去30/90取引日(デイリーバーのみ)
週末や取引のないギャップを除外するのに最適です。
✅ カスタマイズ可能な表示
- 画面位置の調整(右上など)
- テキストカラーのカスタマイズ
- 軽量で邪魔にならないオーバーレイ
🎯 このツールを使う理由
- ボラティリティの拡大と収縮を識別
- 本日のレンジを過去の平均と比較
- ブレイクアウト前の圧縮を検出
- ADRコンテキストに基づく取引のフィルタリング
- ボラティリティ条件に基づくリスクサイズの改善
日中取引、スイング、ゴールド取引のいずれであっても、このツールは煩雑さなく即時のボラティリティ情報を提供します。
⚙️ 理想的な用途
- 外国為替トレーダー
- ゴールド(XAUUSD)トレーダー
- インデックストレーダー
- ボラティリティベースのシステム
- ブレイクアウトトレーダー
- 機関スタイルのレンジ分析
🚀 プロフェッショナルなボラティリティ認識 - 直接チャート上で
パフォーマンス、精度、セッションの正確さのために構築されています。
概要
インジケーターのプロフィール
カスタマーレビュー
4.5
レビュー: 2
5 | 50 % | |
4 | 50 % | |
3 | 0 % | |
2 | 0 % | |
1 | 0 % |
ディスカッション
よくあるご質問
Signal
Indices
Commodities
GBPUSD
RSI
Bollinger
Fibonacci
Scalping
AI
XAUUSD
NAS100
MACD
BTCUSD
Forex
Breakout
EURUSD
NZDUSD
Martingale
Prop
ZigZag
Supertrend
Fair Value Gap
SMC
Crypto
Grid
Stocks
ATR
USDJPY
VWAP
cTrader Storeで入手可能な取引ボット、インジケーター、プラグインなどの商品は、第三者の開発者が提供するものであり、情報と技術の取得のみを目的としてご利用いただけます。cTrader Storeはブローカーではなく、投資助言や個人的な推奨を行うことも、将来のパフォーマンスを保証することもありません。


価格
登録日 31/10/2024
56
販売
1.73K
無料インストール