
Market Structure Pro
インジケーター
3 購入済
バージョン 1.2、Jan 2026
Windows、Mac
4.3
レビュー: 3
説明
Market Structure Pro – トレンドライン、ゾーン&スマートエントリー
Market Structure Proは、市場のスイング構造、主要なサポート/レジスタンス、真のトレンドライン、HH/LLゾーンを自動的にマッピングし、内蔵の確認ロジックで高確率のプルバックエントリーをオプションでハイライトする完全なプライスアクションツールキットです。
すべてを手動で描く代わりに、このインジケーターはバックグラウンドでチャートを継続的にスキャンし、構造、ゾーン、シグナルをリアルタイムで最新の状態に保ちます。
このインジケーターの機能
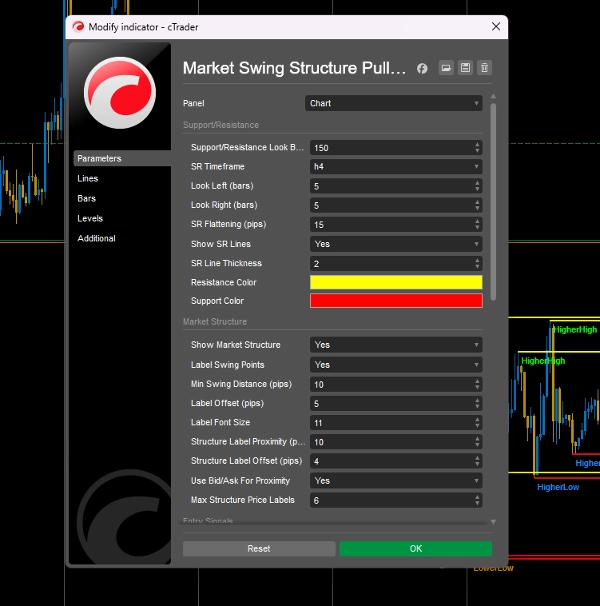
- 自動サポート&レジスタンス
-
- 設定可能な過去範囲内でスイングの高値/安値を検出します。
- ピップ許容範囲を使って近接レベルをよりクリーンなゾーンに平坦化します。
- 任意の選択した時間枠でインタラクティブなSRラインを描画します(例:M15エントリーでの4H SR)。
- サポートとレジスタンスの厚さと色は完全にカスタマイズ可能です。
- 真の外側トレンドライン
-
- 検証済みのスイングポイントから上昇/下降のサポートおよびレジスタンストレンドラインを構築します。
- 方向ごとに表示するトレンドラインの数を制限し、将来に向けて延長する制御機能があります。
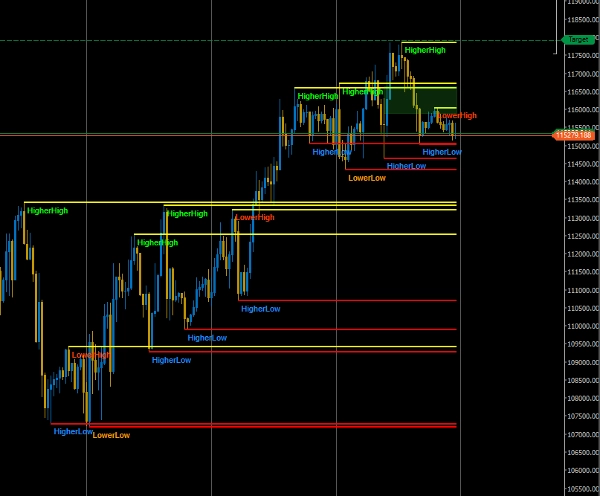
- マーケット構造マッピング(HH、HL、LH、LL)
-
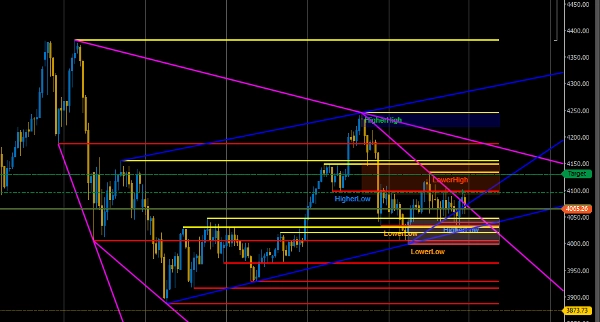
- チャート上に直接、Higher High、Higher Low、Lower High、Lower Lowのスイングをラベル付けします。
- 市場のノイズを除去するための調整可能な最小スイング距離(ピップ単位)。
- チャートをクリーンに保つためにアクティブなラベル数を制限します。
- ライブテキストで「現在のトレンド」(上昇トレンド/下降トレンド/横ばい、反転の注記付き)を表示します。
- 内蔵の「次の構造予測」メッセージで方向性のコンテキストを提供します。
- HH/LLソースキャンドルゾーン
-
- 最後のHigher HighおよびLower Lowのソースキャンドルからゾーンを自動描画します。
- 3つのゾーンモード:
-
- フルキャンドル(高値 ↔ 安値)
- ボディのみ(始値/終値の範囲)
- ウィックのみ(HHは上ヒゲ、LLは下ヒゲ)
- ゾーンのパディング(ピップ)、不透明度、ロング/ショートゾーンの色、ゾーンを現在のバーまで延長するかの選択。
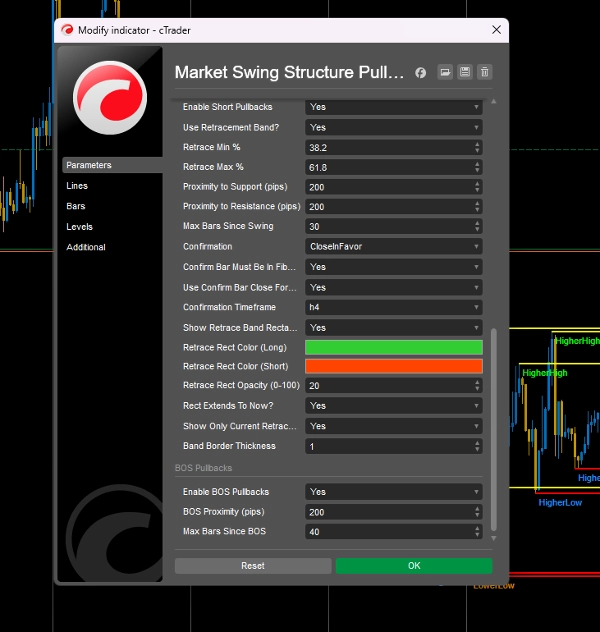
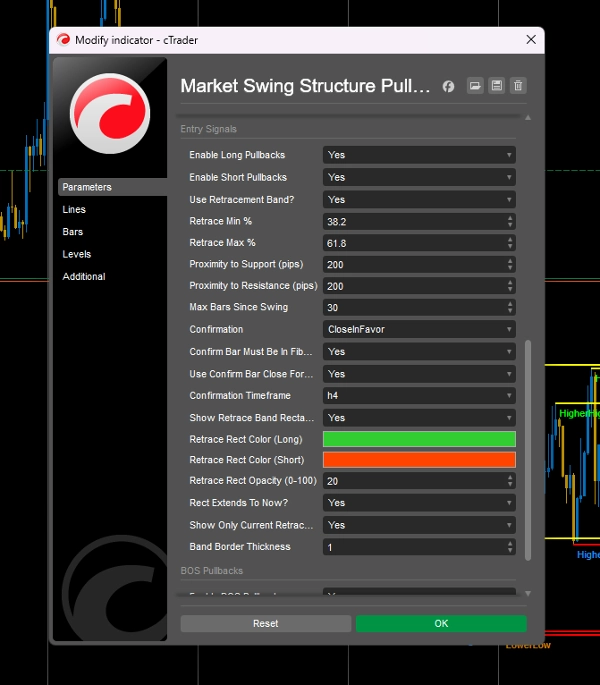
- スマートエントリーシグナル(オプション)
-
- すべてのエントリーシグナルをオン/オフするマスタートグル。
- スイングプルバックエントリー:
-
- 最新のインパルスレッグ(HH–HLまたはLH–LL)を使用します。
- 買い/売りのためのフィボナッチスタイルのリトレースメントバンド(例:38.2–61.8%)を構築します。
- スイングポイントとSRレベルへの近接をチェックします。
- スイング後にシグナルが有効なバー数を制限します。
- ブレイクオブストラクチャー(BOS)プルバック:
-
- 主要なLH/HLのブレイクを通じてBOSを検出します。
- BOSレベルおよび近接SRのリテストを探します。
- 近接および「BOS以降のバー数」フィルターを別々に使用します。
- 確認エンジン
-
- エントリーのための複数の確認モード:
-
- 有利なクローズのみ
- 包み足のみ
- クローズ+包み足
- なし(生のシグナル)
- 確認キャンドルがリトレースメントバンド内にある必要があるオプションの要件。
- 別の確認時間枠(例:M15取引中にH4で確認)。
- 確認バーのクローズを実際のシグナル価格/時間として使用することも選択可能です。
- 視覚&パフォーマンスコントロール
-
- 調整可能なラベルオフセット、フォントサイズ、最大構造ラベル数。
- リトレースメントバンドとゾーンの長方形の不透明度、境界線の太さ、「現在まで延長」の動作。
- 低時間枠でも計算を効率的に保つタイマーによる更新。
対象ユーザー
- マーケット構造(HH/HL/LH/LL)に依存するプライスアクショントレーダー。
- エントリーチャートにより高い時間枠のSRとトレンドラインを表示したいスイングおよび日中トレーダー。
- 明確な確認付きで主要な構造、ゾーン、BOSレベル周辺のルールベースのプルバックエントリーを探しているトレーダー。
使い方
- SRの時間枠を選択(例:H4)および過去範囲を設定します。
- トレンドラインを有効にし、延長や週末ギャップのフィルター設定を調整します。
- マーケット構造とラベルをオンにしてHH/HL/LH/LLおよびライブトレンド/予測を表示します。
- ゾーンを有効にし、好みの範囲モード(フル、ボディ、ウィックのみ)を選択します。
- シグナルが欲しい場合は、エントリーシグナルを有効にし、リトレースメントバンド(例:38.2–61.8%)、近接設定、確認動作を設定します。
リスク管理と実行は引き続きご自身でコントロールしてください。Market Structure Proは構造化された視覚的フレームワークを提供し、描画ではなく意思決定に集中できるようにします。
概要
AIによる概要
Market Structure Pro is a price-action indicator designed to automate the identification and visualization of key market elements for traders. It automatically detects swing highs and lows to map support and resistance zones, consolidating nearby levels into cleaner zones with customizable appearance. The indicator draws validated ascending and descending trendlines and labels market structure swings as Higher Highs, Higher Lows, Lower Highs, and Lower Lows, providing live trend status and next structure predictions.
It features auto-drawn zones based on the last Higher High and Lower Low source candles, with options for full candle, body only, or wick-only ranges. Smart entry signals include swing pullback entries using Fibonacci-style retracement bands and break-of-structure (BOS) pullbacks, both filtered by proximity and time since the swing or BOS event. A confirmation engine supports multiple modes such as close-in-favor, engulfing candles, or combined confirmations, with configurable confirmation timeframes and signal price options.
Visual and performance controls allow adjustment of label offsets, font sizes, opacity, and update frequency to maintain chart clarity and efficiency. Market Structure Pro supports various markets including Forex, indices, commodities, stocks, and cryptocurrencies, and is suitable for price-action, swing, and intraday traders seeking structured, rule-based analysis and entry signals without manual drawing.
インジケーターのプロフィール
カスタマーレビュー
4.3
レビュー: 3
5 | 33 % | |
4 | 67 % | |
3 | 0 % | |
2 | 0 % | |
1 | 0 % |
カスタマーレビュー
October 23, 2025
ngl, this one makes sense if you are not trying to yolo every signal. Keeping it on demo first and see how it behaves when liquidity moves gets messy.
October 20, 2025
tested like a normal trader would, small size first. The idea is fine, but No need to scale it before seeing how it handles bad days.
October 10, 2025
I liked it more as a extra filter for smart money style analysis than as something to follow blindly. Structure is easier to map, and the final decision still feels like it belongs to the trader.
ディスカッション
よくあるご質問
BTCUSD
Forex
Signal
Breakout
Indices
EURUSD
Commodities
GBPUSD
NZDUSD
Fibonacci
Prop
Scalping
Supertrend
SMC
Crypto
Stocks
XAUUSD
NAS100
USDJPY
cTrader Storeで入手可能な取引ボット、インジケーター、プラグインなどの商品は、第三者の開発者が提供するものであり、情報と技術の取得のみを目的としてご利用いただけます。cTrader Storeはブローカーではなく、投資助言や個人的な推奨を行うことも、将来のパフォーマンスを保証することもありません。


価格
登録日 31/10/2024
56
販売
1.74K
無料インストール