
Opis
🔍 Analizuje dane wolumenowe z określonego okresu historycznego, wskazując potencjalne obszary, w których inwestorzy z wysoką dźwignią mogą napotkać likwidacje, dostarczając cennych informacji o zachowaniu rynku.
Co robi ten wskaźnik?
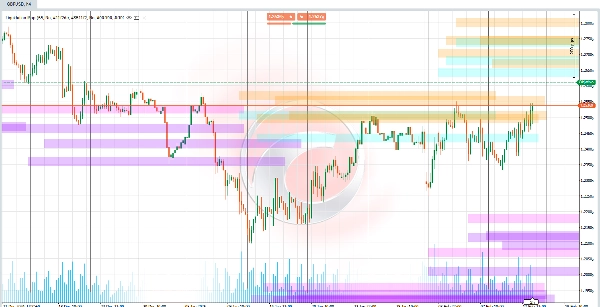
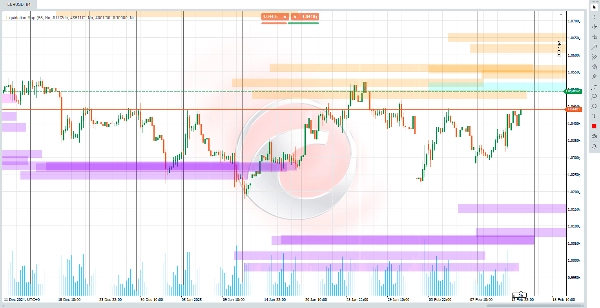
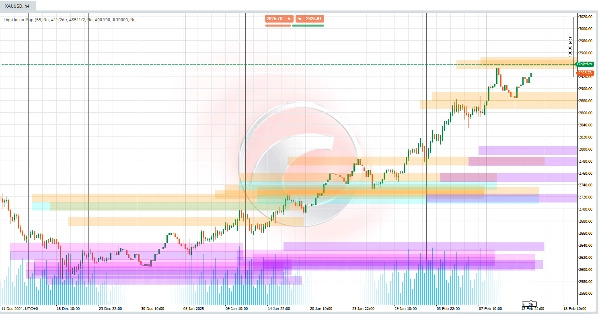
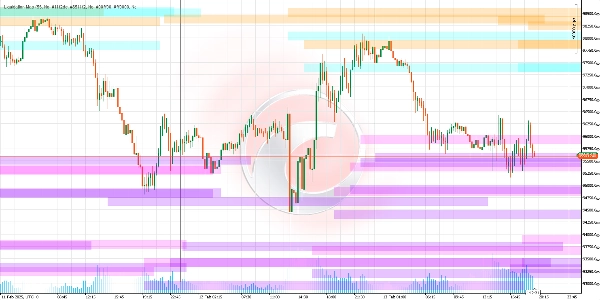
Ten algorytm identyfikuje poziomy cen, na których masowe likwidacje pozycji z dźwignią (takich jak 5x, 10x, 25x, 50x lub 100x) prawdopodobnie wystąpią. Poziomy te działają jak "magnesy" dla ruchów cen, ponieważ likwidacje mogą wywołać gwałtowne wahania rynku. Wskaźnik rysuje poziome linie na wykresie, reprezentujące te progi i prognozuje je w przyszłość, aby przewidzieć kluczowe strefy zainteresowania.
Jak obliczane są te poziomy?
- Wykrywanie punktów zwrotnych cen:
🔄 Identyfikuje ostatnie maksima i minima na wykresie (punkty, w których cena zmienia kierunek). Te punkty zwrotne są podstawą do obliczania poziomów likwidacji. - Wolumen jako wyzwalacz:
📊 Porównuje aktualny wolumen z historyczną średnią. Jeśli wolumen przekracza określone progi (np. 1,2x średniej dla 100x), aktywuje odpowiednie poziomy likwidacji. - Formuła likwidacji:
Im wyższa dźwignia, tym bliżej aktualnej ceny znajduje się poziom likwidacji. -
- Dla pozycji długich: Poziom likwidacji jest ustalony poniżej punktu zwrotnego minimum, obliczanego na podstawie dźwigni (np. 2% poniżej dla 50x).
- Dla pozycji krótkich: Poziom jest ustalony powyżej punktu zwrotnego maksimum, stosując tę samą zasadę.
Czego możesz się spodziewać podczas korzystania z niego?
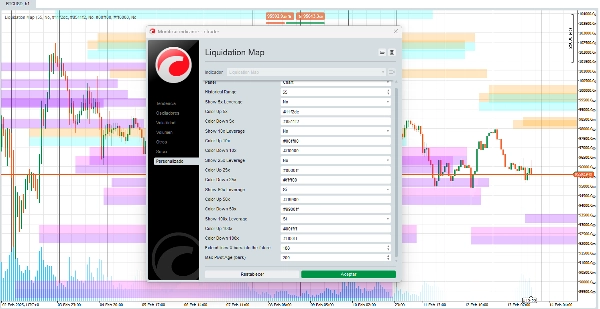
- Linie płynności: 🎨 Zobaczysz konfigurowalne linie poziome reprezentujące strefy, w których rynek może doświadczyć dużej zmienności z powodu likwidacji.
- Konfigurowalne dźwignie: ⚙️ Możesz włączyć/wyłączyć poziomy dla każdego typu dźwigni (np. skupić się tylko na 50x i 100x).
- Personalizacja kolorów: 🌈 Możesz wybrać kolor dla każdego zakresu likwidacji, dostosowując wizualizację do swoich preferencji.
- Strefy zatorów: 🎯 Wiele linii blisko siebie sugeruje obszary wysokiego ryzyka/wysokiej nagrody, gdzie może dojść do jednoczesnych likwidacji.
Jak interpretować sygnały?
- Cena zbliża się do linii: 🚨 Jeśli cena zbliża się do poziomu likwidacji (zwłaszcza przy wysokim wolumenie), rośnie prawdopodobieństwo gwałtownego ruchu.
- Kolor i przezroczystość: 🎨 Kolory różnią się w zależności od dźwigni (np. niebieski dla 25x, pomarańczowy dla 50x). Przezroczystość wskazuje "siłę" powiązanego wolumenu (ciemniejsze linie = większy wolumen).
Dlaczego jest to przydatne?
- Proaktywne prognozowanie: 🔮 Nie analizuje tylko przeszłości; prognozuje przyszłe poziomy na podstawie aktualnych warunków.
- Skupienie na psychologii rynku: 🧠 Wymuszone likwidacje często wywołują reakcje łańcuchowe (np. zlecenia stop-loss wywołujące kolejne wyprzedaże). Ten wskaźnik pomaga je przewidzieć.
- Personalizacja: 🛠️ Dostosuj wizualizację do swojej strategii (np. priorytetuj wyższe dźwignie na niestabilnych rynkach).
Ograniczenia do rozważenia
- Zależność od wolumenu: 📉 Jeśli wolumen jest niski lub dane historyczne niewystarczające, sygnały mogą być mniej wiarygodne.
- Nie jest kulą kryształową: 🔮 Poziomy wskazują prawdopodobne strefy, nie pewniki. Zawsze łącz go z innymi analizami.
- Dynamiczne środowisko: 🌍 Na rynkach z niespodziewanymi wiadomościami likwidacje mogą wystąpić poza prognozowanymi poziomami.
Wskaźniki ze sklepu Ctrader:
Dynamic Market Structure
Analysis of Turning Points
Fibonacci Linear
Regression Multi-timeframe
Multi-Level Candle Bias
Tracker
Auto Support and
Resistance Trend Lines
Podsumowanie
Opinie klientów
5 | 67 % | |
4 | 0 % | |
3 | 33 % | |
2 | 0 % | |
1 | 0 % |


